Elite Mathematics / Linear / Topics / Histograms IGCSE · 4MA1 · Topic Histograms: past paper questions & worked solutions
Every Histograms question from the 4MA1 papers in our bank, 2020–2026, sorted from easiest to hardest. Try each one first, then open the worked solution.
27 questions
102 marks in total
50% of papers (27 of 54) include it
0/20/7 easy / medium / hard
Questions, easiest first Level is estimated from marks: 1–2 easy, 3–4 medium, 5+ hard.
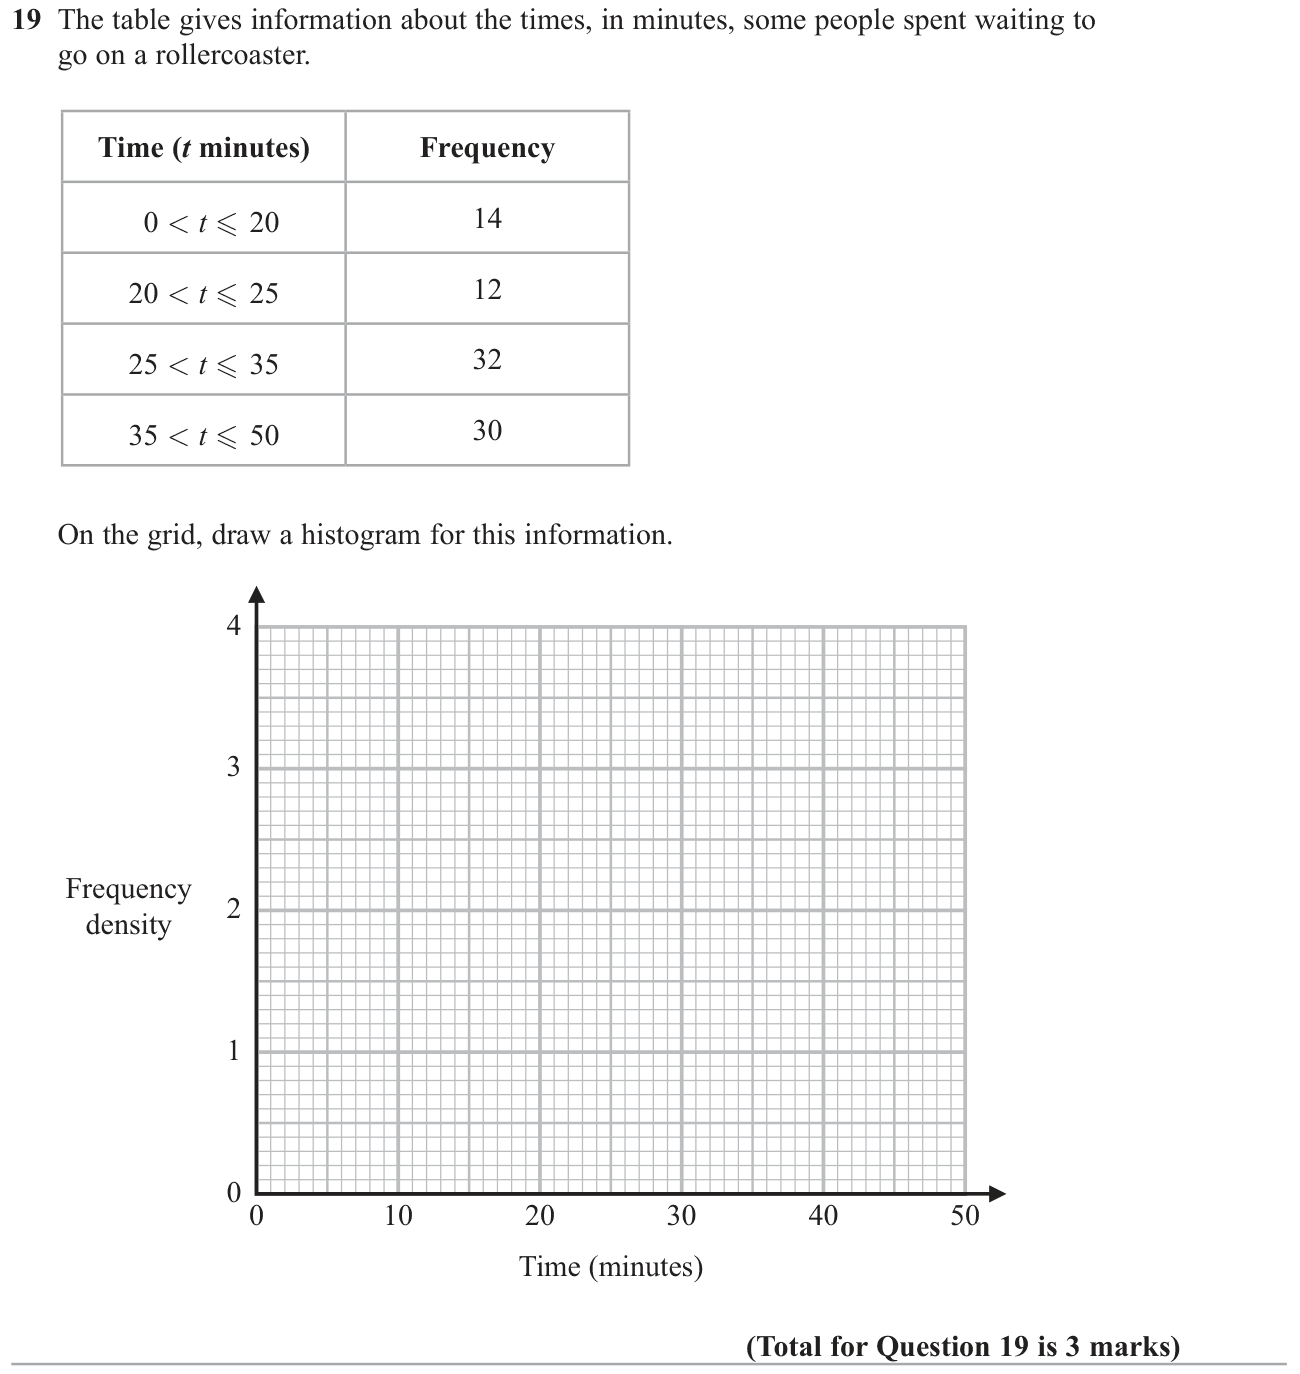
1. Jun 2026 P2HR · Q19 Medium 3 marksShow worked solution Solution | Step 1 Use \(\text{frequency density}=\text{frequency}/\text{class width}\): \[14/20=0.7,\quad12/5=2.4,\quad32/10=3.2,\quad30/15=2.\]
Histogram areas, rather than heights alone, represent frequencies.
Solution | Step 2 Draw four adjoining rectangles on the supplied time and frequency-density axes: \([0,20]\) at height \(0.7\), \([20,25]\) at height \(2.4\), \([25,35]\) at height \(3.2\), and \([35,50]\) at height \(2\).
Each rectangle starts at density 0 and has the stated class boundaries as its vertical edges; leave no gaps between classes.
Final answer Bar intervals/heights: \([0,20]:0.7;\ [20,25]:2.4;\ [25,35]:3.2;\ [35,50]:2\).
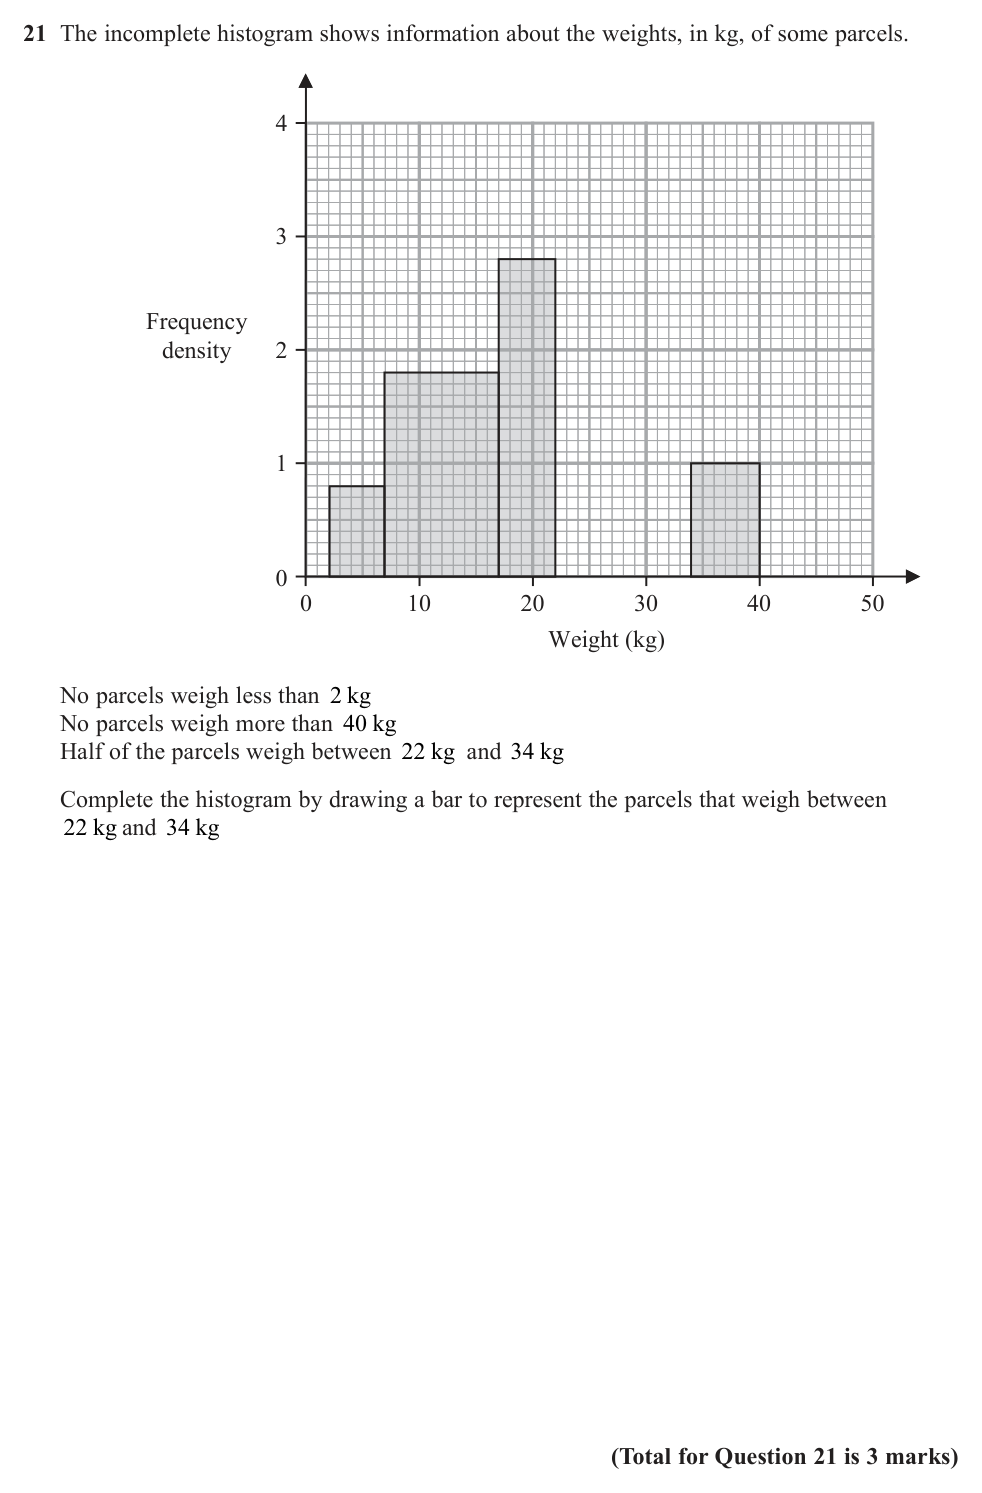
2. May 2026 4WM1H · Q21 Medium 3 marksShow worked solution Frequency = width × height \[5(0.8)+10(1.8)+5(2.8)+6(1)=4+18+14+6=42\]
Half are in 22–34 So the other half is also \(42\) parcels.
Height of the new bar \[\text{f.d.}=\frac{42}{34-22}=3.5\]
Final answer Bar from \(22\) to \(34\) kg, height \(3.5\)
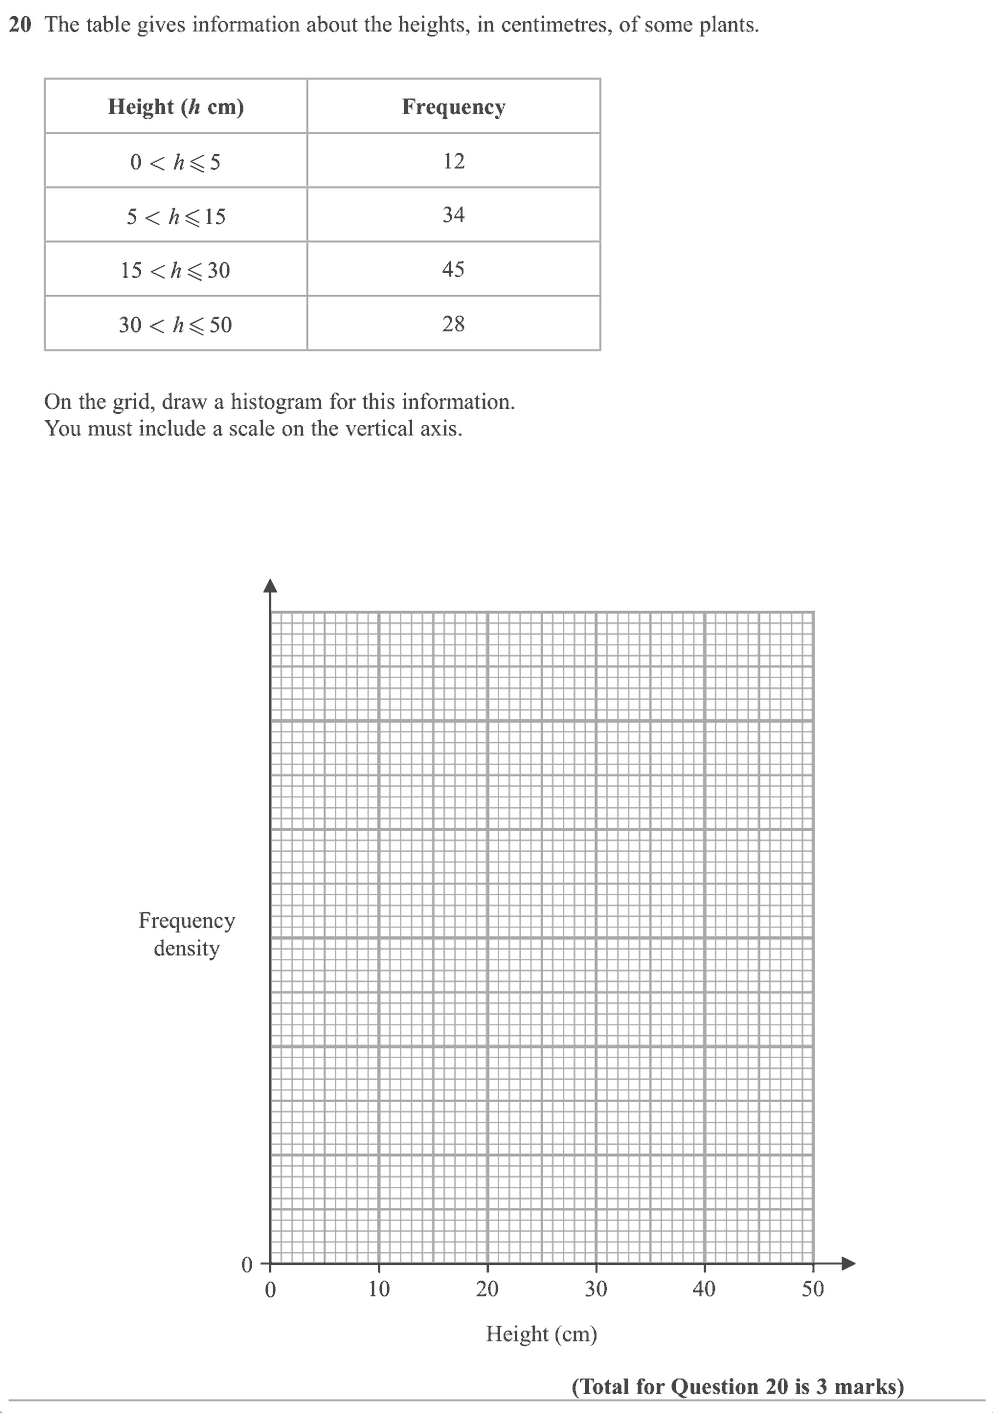
3. Nov 2025 4WM1H · Q20 Medium 3 marksShow worked solution Frequency density Frequency density \(=\dfrac{\text{frequency}}{\text{class width}}\).
\[
0<h\le 5: \frac{12}{5}=2.4
\]
\[
5<h\le 15: \frac{34}{10}=3.4
\]
\[
15<h\le 30: \frac{45}{15}=3
\]
\[
30<h\le 50: \frac{28}{20}=1.4
\]
Final answer draw bars with densities \(2.4, 3.4, 3, 1.4\).
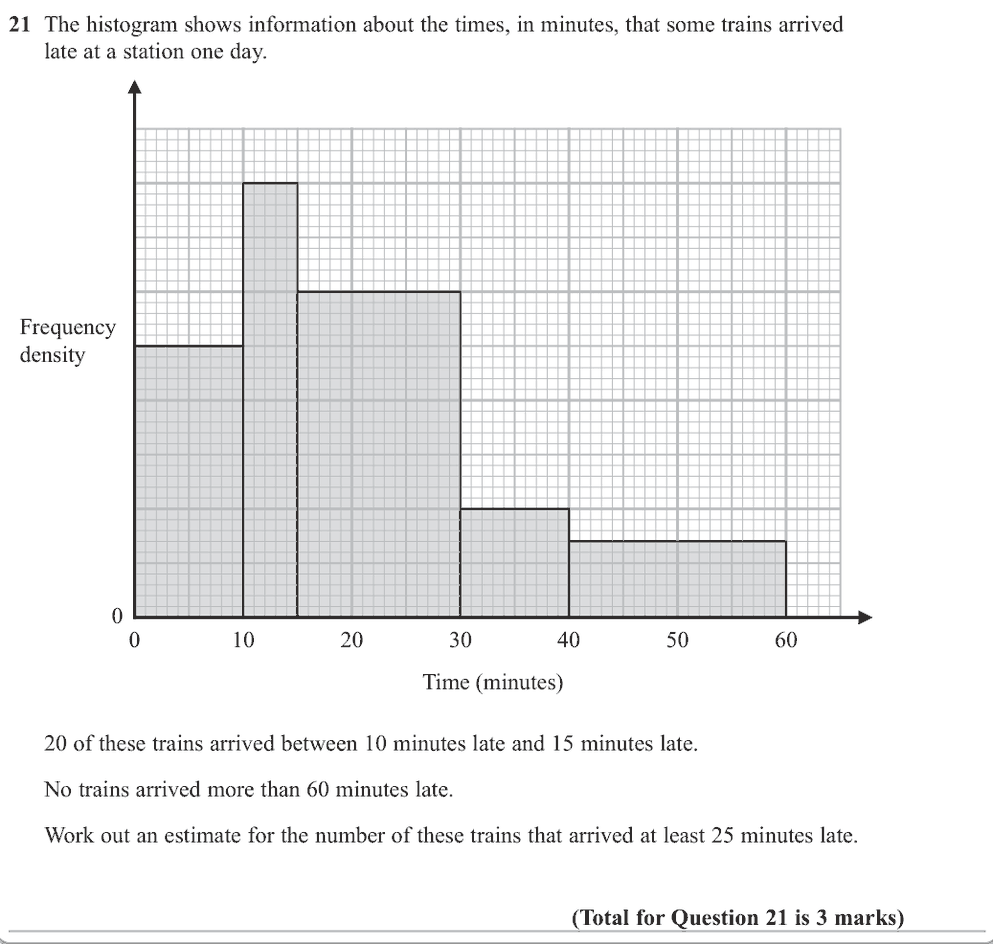
4. Nov 2025 P2H · Q21 Medium 3 marksShow worked solution Use histogram For a histogram,
\[
\text{frequency}=\text{class width}\times \text{frequency density}
\]
Use frequency table For \(10<t\leq15\), the frequency is 20 and the class width is 5, so
\[
\text{frequency density}=\frac{20}{5}=4
\]
Use histogram Using this scale from the histogram:
\[
15<t\leq30 \quad \text{has frequency density } 3
\]
\[
30<t\leq40 \quad \text{has frequency density } 1
\]
\[
40<t\leq60 \quad \text{has frequency density } 0.7
\]
Calculate value For trains at least 25 minutes late:
\[
(5)(3)+(10)(1)+(20)(0.7)
\]
\[
=15+10+14
\]
\[
=39
\]
Final answer \(39\) trains
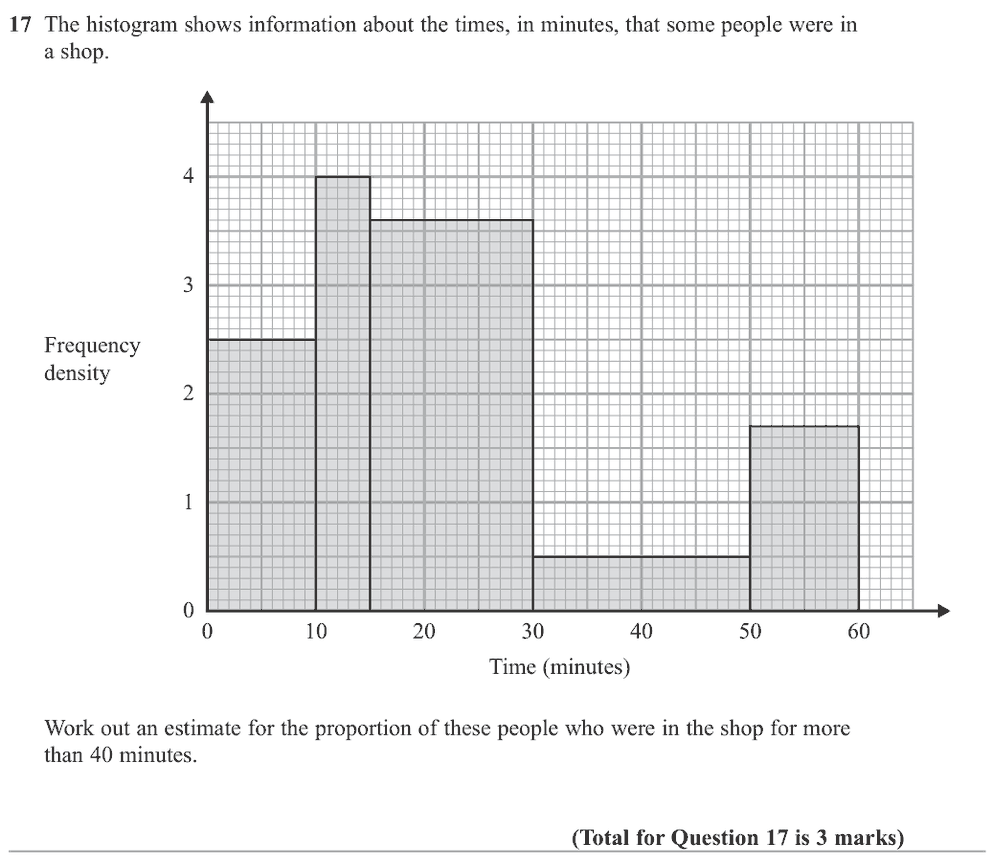
5. Jun 2025 P1H · Q17 Medium 3 marksShow worked solution Total estimated frequency Total estimated frequency:
\[
10(2.5)+5(4)+15(3.6)+20(0.5)+10(1.7)=126
\]
More than minutes More than \(40\) minutes:
\[
10(0.5)+10(1.7)=22
\]
Use histogram So the proportion is
\[
\frac{22}{126}=\frac{11}{63}
\]
Final answer \(\frac{11}{63}\).
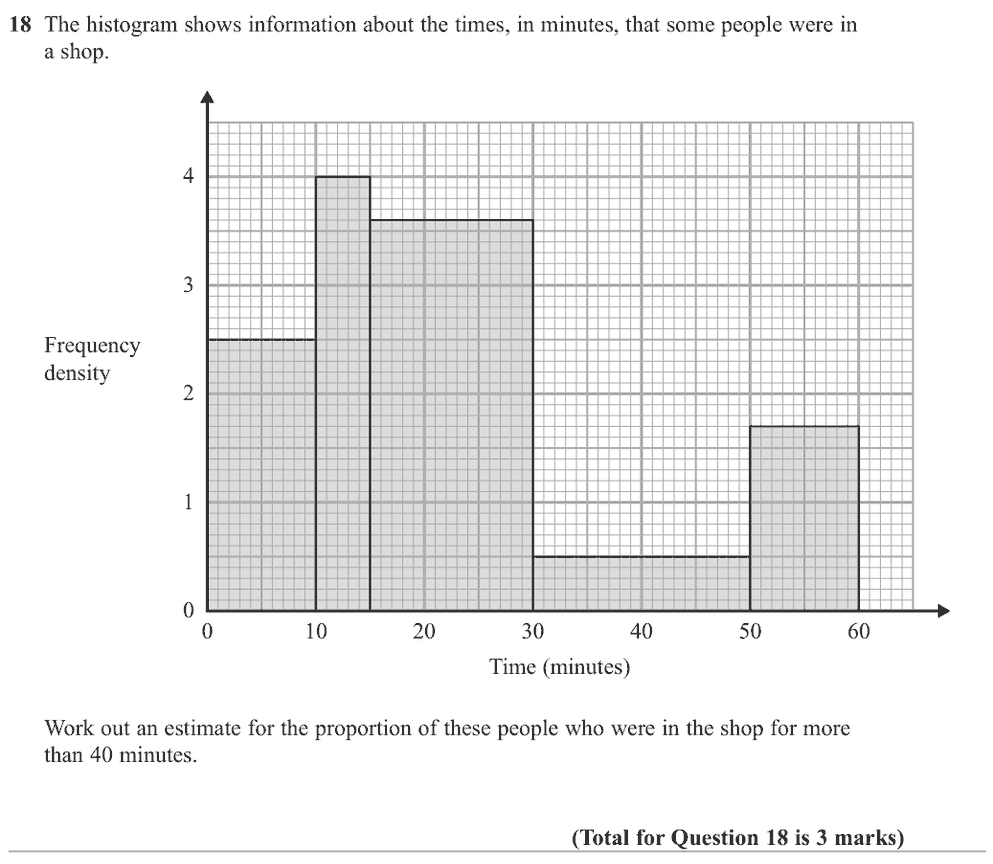
6. May 2025 4WM1H · Q18 Medium 3 marksShow worked solution Frequency is class width multiplied Frequency is class width multiplied by frequency density.
\[
0\text{--}10:10\times2.5=25
\]
\[
10\text{--}15:5\times4=20
\]
\[
15\text{--}30:15\times3.6=54
\]
\[
30\text{--}50:20\times0.5=10
\]
\[
50\text{--}60:10\times1.7=17
\]
Total Total:
\[
25+20+54+10+17=126
\]
More than minutes is the More than \(40\) minutes is the part from \(40\) to \(50\), plus \(50\) to \(60\).
\[
10\times0.5+17=22
\]
Use histogram So the proportion is
\[
\frac{22}{126}=\frac{11}{63}
\]
Final answer \(\frac{11}{63}\)
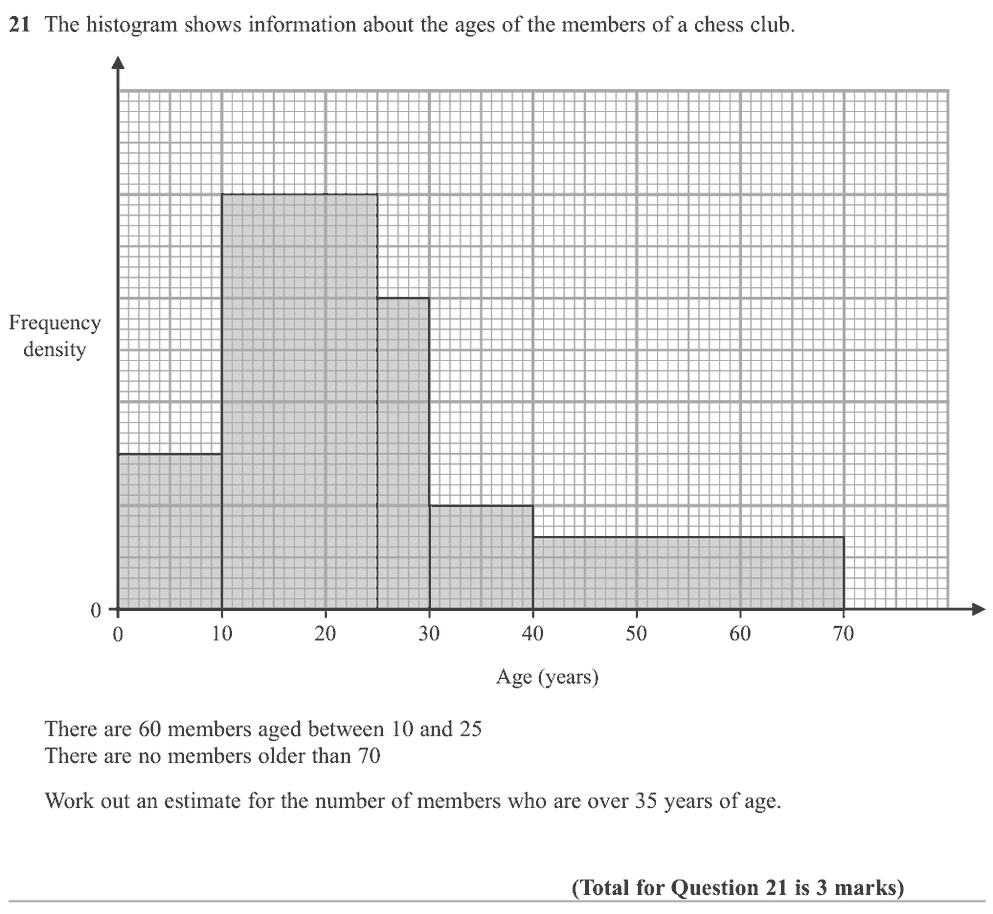
7. May 2025 4WM1HR · Q21 Medium 3 marksShow worked solution The interval to has width The interval \(10\) to \(25\) has width \(15\) and frequency \(60\), so its frequency density is
\[
\frac{60}{15}=4
\]
Use histogram Using that scale from the histogram:
\[
35\text{ to }40: 5\times 1=5
\]
\[
40\text{ to }70: 30\times 0.75=22.5
\]
\[
5+22.5=27.5
\]
Final answer about \(28\) members.
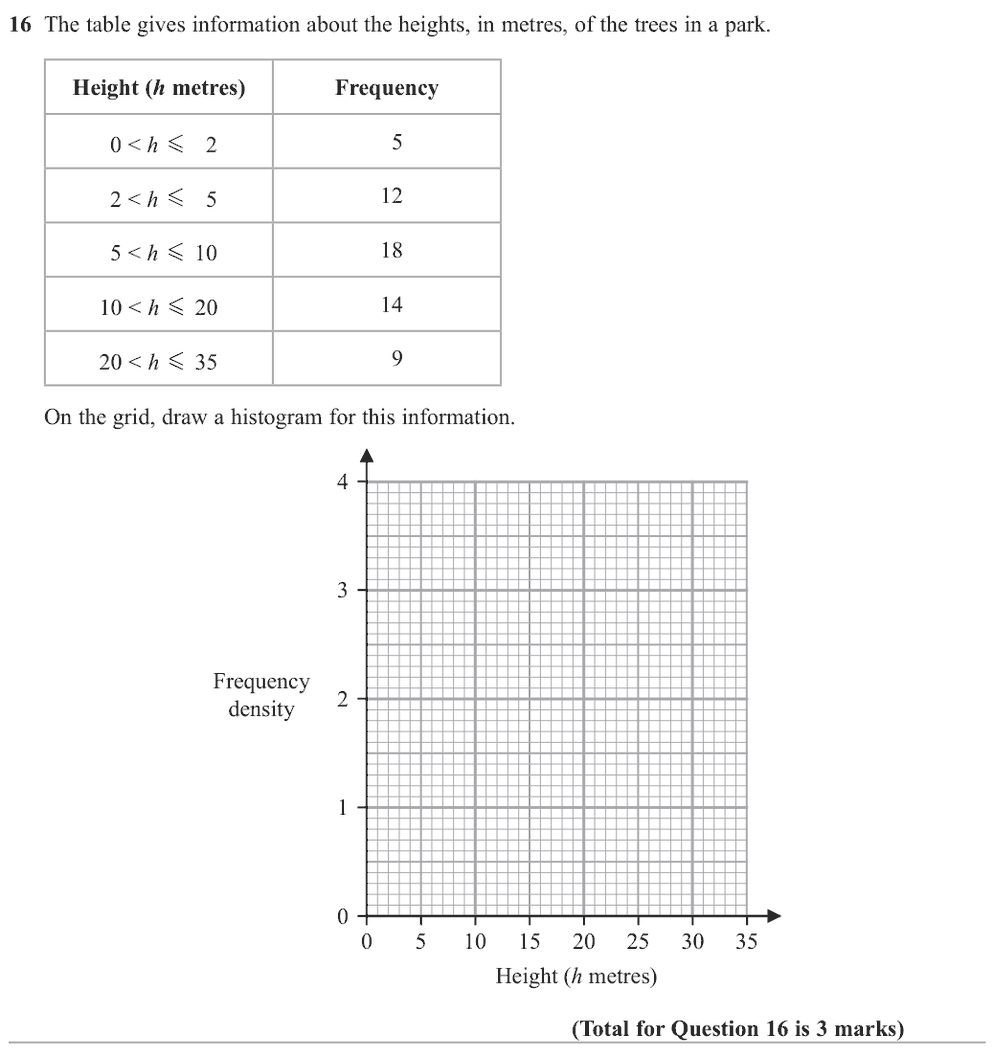
8. May 2024 P1HR · Q16 Medium 3 marksShow worked solution Use histogram For a histogram,
\[
\text{frequency density}=\frac{\text{frequency}}{\text{class width}}
\]
The bar heights are The bar heights are:
\[
0<h\le 2:\frac52=2.5
\]
\[
2<h\le 5:\frac{12}{3}=4
\]
\[
5<h\le 10:\frac{18}{5}=3.6
\]
\[
10<h\le 20:\frac{14}{10}=1.4
\]
\[
20<h\le 35:\frac{9}{15}=0.6
\]
Final answer draw bars with heights \(2.5,4,3.6,1.4,0.6\).
9. May 2024 P1H · Q22 Medium 3 marksShow worked solution Use histogram For a histogram,
\[
\text{frequency}=\text{class width}\times \text{frequency density}
\]
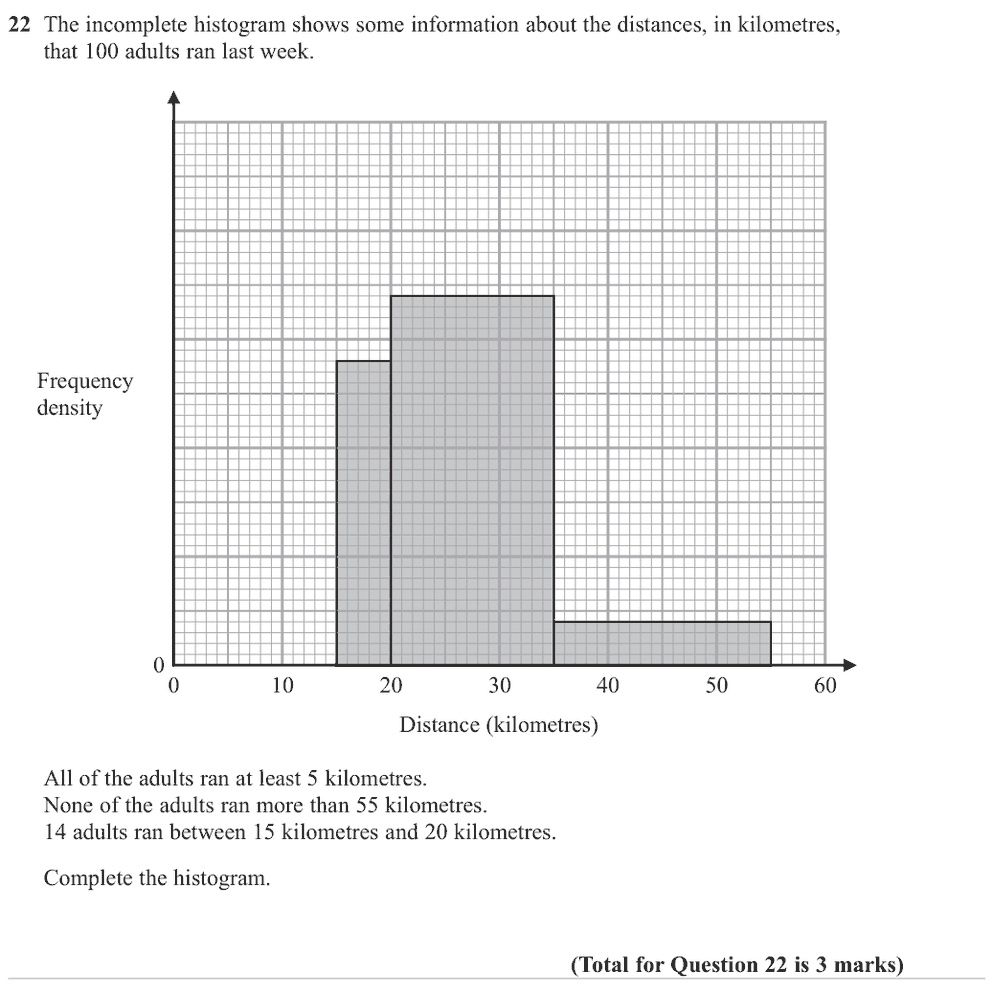
Use frequency table For \(15\leq d<20\), the frequency is 14 and the class width is 5, so
\[
\text{frequency density}=\frac{14}{5}=2.8
\]
Use histogram Using this scale from the histogram:
\[
20\leq d<35 \quad \text{has frequency density } 3.4
\]
\[
35\leq d\leq55 \quad \text{has frequency density } 0.4
\]
Calculate value So the known frequencies are
\[
14+(15)(3.4)+(20)(0.4)
\]
\[
=14+51+8=73
\]
Use frequency table There are 100 adults in total, so the missing frequency from 5 km to 15 km is
\[
100-73=27
\]
The missing class width is The missing class width is 10, so its frequency density is
\[
\frac{27}{10}=2.7
\]
Final answer draw the missing bar from \(5\) to \(15\) with frequency density \(2.7\)
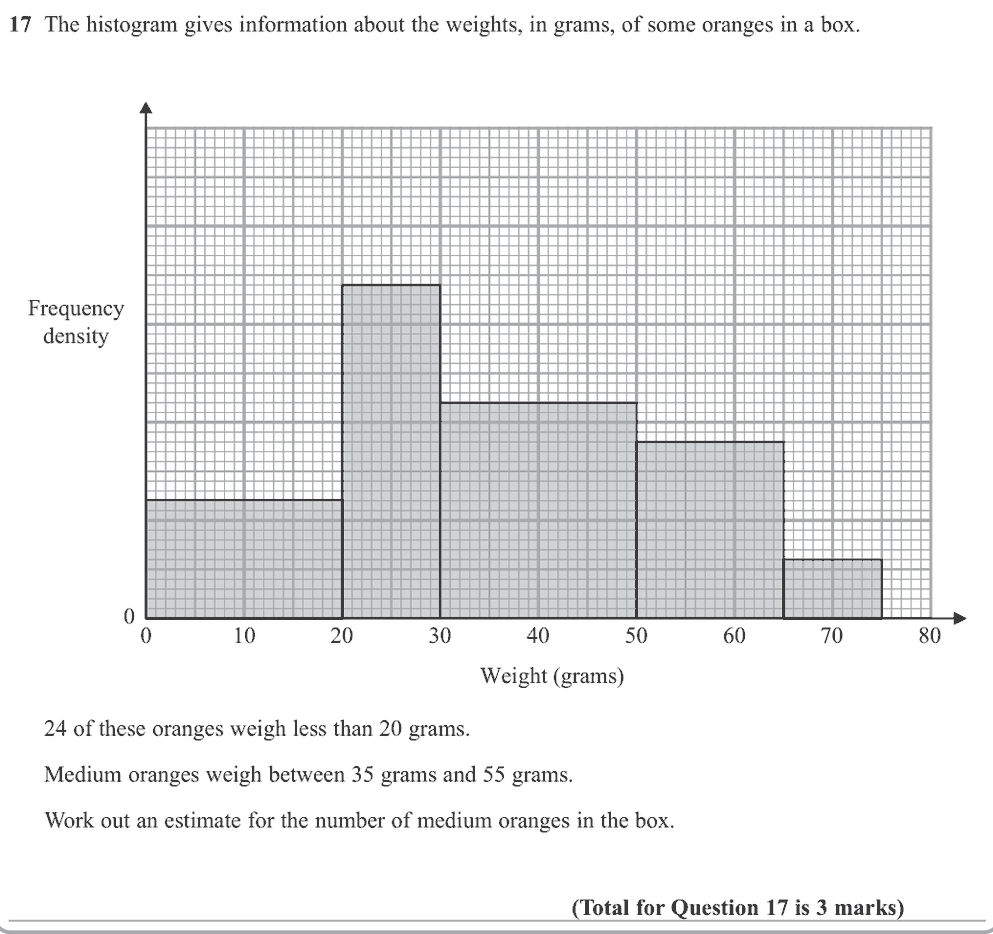
10. Nov 2023 P1H · Q17 Medium 3 marksShow worked solution The to gram class has The \(0\) to \(20\) gram class has frequency \(24\), so its density is
\[
\frac{24}{20}=1.2
\]
Use histogram From the histogram scale, the density for \(30<w\le 50\) is about \(2.2\), and the density for \(50<w\le 65\) is about \(1.8\).
Medium oranges weigh between g Medium oranges weigh between \(35\) g and \(55\) g:
\[
15(2.2)+5(1.8)=33+9=42
\]
Final answer about \(42\) medium oranges.
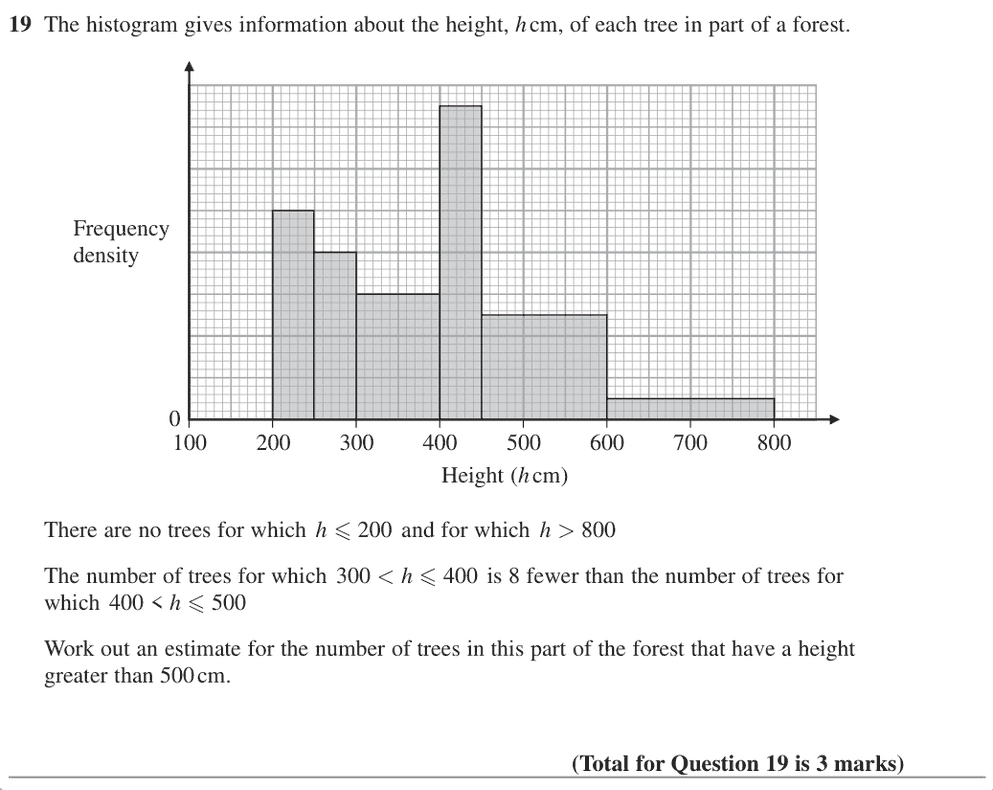
11. Jun 2022 P1HR · Q19 Medium 3 marksShow worked solution Use relative densities from the Use relative densities from the histogram:
\[
10,\ 8,\ 6,\ 15,\ 5,\ 1
\]
Use histogram The number of trees with \(300<h\le 400\) is
\[
100(6s)=600s
\]
Use histogram The number of trees with \(400<h\le 500\) is
\[
50(15s)+50(5s)=1000s
\]
The difference is The difference is \(8\):
\[
1000s-600s=8
\]
\[
400s=8
\]
\[
s=0.02
\]
Use histogram For height greater than \(500\):
\[
100(5s)+200(1s)=700s
\]
\[
700(0.02)=14
\]
Final answer \(14\) trees.
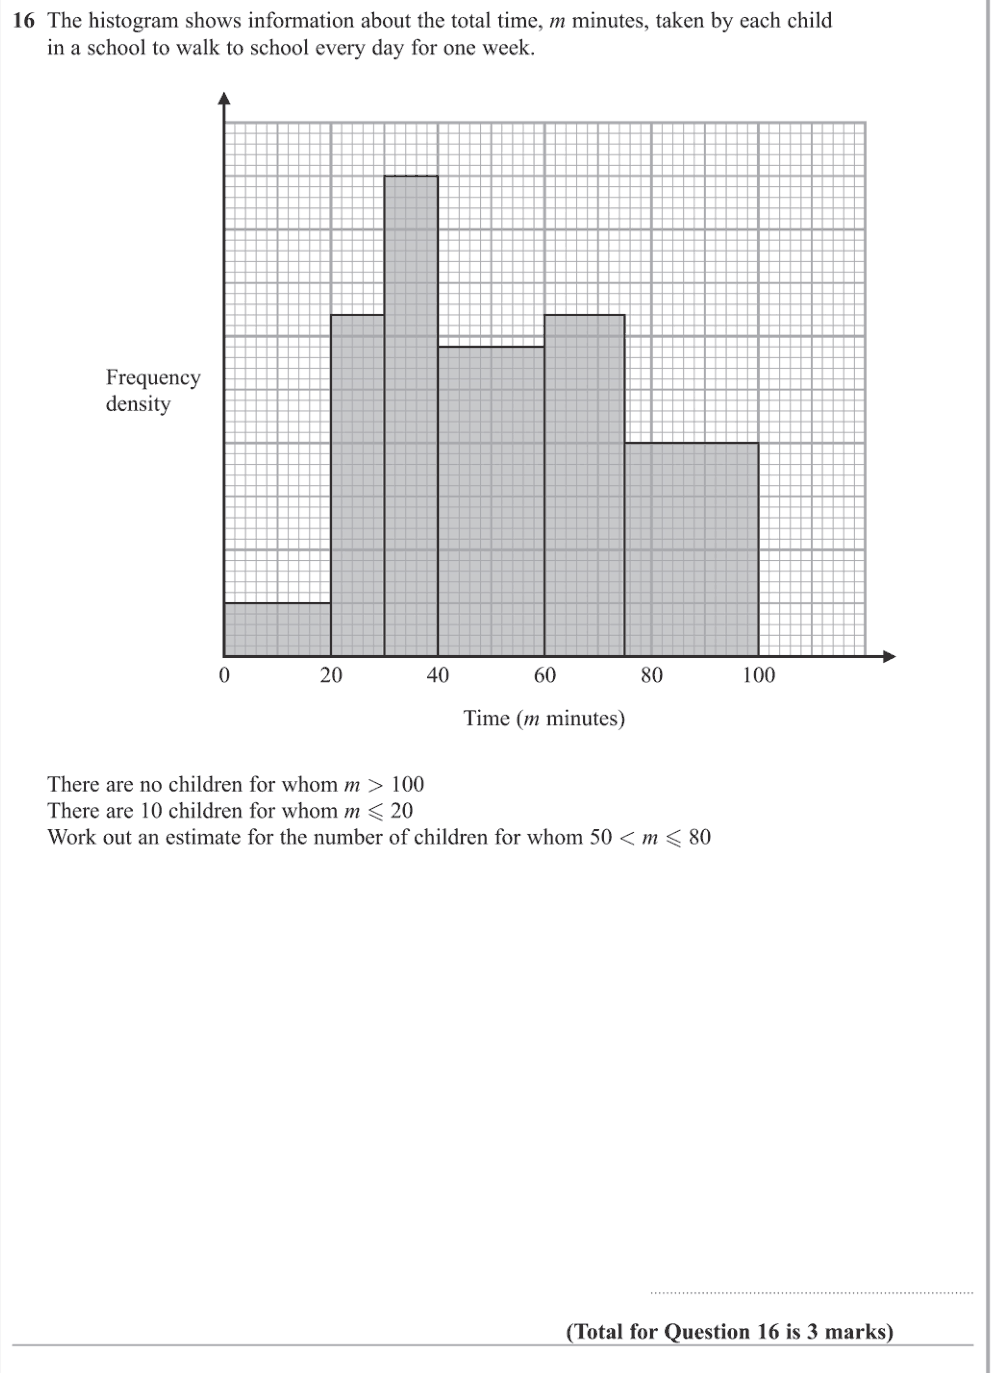
12. Jun 2022 P1H · Q21 Medium 3 marksShow worked solution Use histogram For a histogram,
\[
\text{frequency}=\text{class width}\times \text{frequency density}
\]
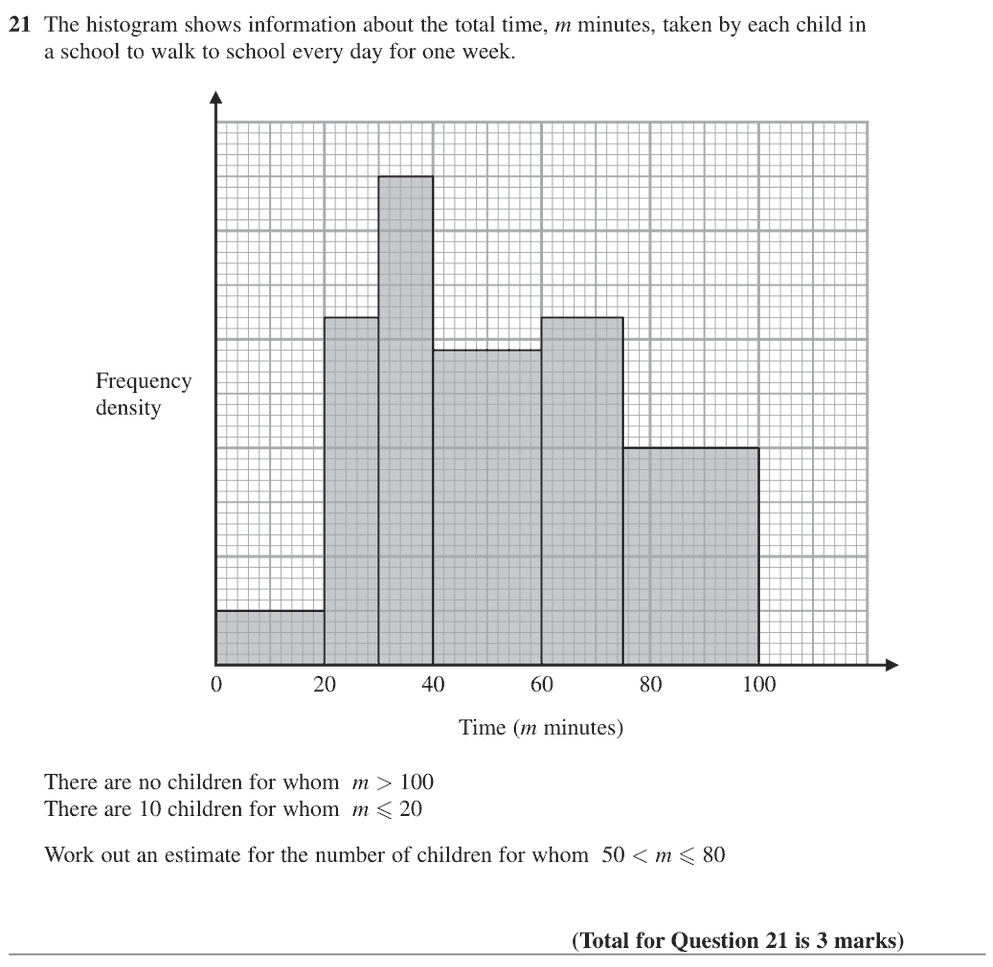
Use frequency table For \(m\leq20\), the frequency is 10 and the class width is 20, so
\[
\text{frequency density}=\frac{10}{20}=0.5
\]
Use histogram Using this scale from the histogram:
\[
40<m\leq60 \quad \text{has frequency density } 2.9
\]
\[
60<m\leq75 \quad \text{has frequency density } 3.2
\]
\[
75<m\leq100 \quad \text{has frequency density } 2.0
\]
Use part of each relevant For \(50<m\leq80\), use part of each relevant bar:
\[
(10)(2.9)+(15)(3.2)+(5)(2.0)
\]
\[
=29+48+10
\]
\[
=87
\]
Final answer \(87\) children
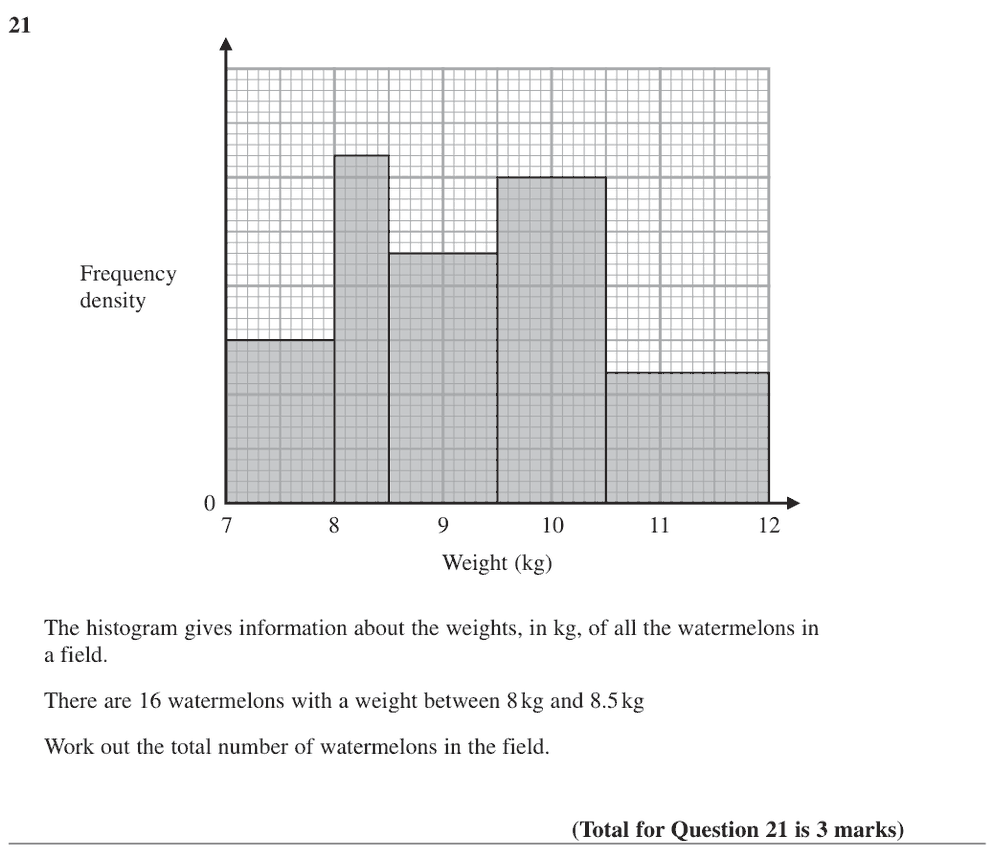
13. Jan 2022 P1HR · Q21 Medium 3 marksShow worked solution Use histogram For a histogram,
\[
\text{frequency}=\text{class width}\times \text{frequency density}
\]
Use frequency table For \(8\leq w<8.5\), the frequency is 16 and the class width is \(0.5\), so
\[
\text{frequency density}=\frac{16}{0.5}=32
\]
Use histogram Using this scale from the histogram, the frequency densities are:
\[
15,\ 32,\ 23,\ 30,\ 12
\]
The total frequency is \[
(1)(15)+(0.5)(32)+(1)(23)+(1)(30)+(1.5)(12)
\]
\[
=15+16+23+30+18
\]
\[
=102
\]
Final answer \(102\) watermelons
14. Specimen 4WM1H · Q16 Medium 3 marksShow worked solution Set the frequency-density scale For \(0<m\le 20\), the frequency is \(10\), so
\[
\text{frequency density}=\frac{10}{20}=0.5
\]
Read the needed bar heights Using the same scale from the histogram:
\[
50<m\le 60:\ 10\times 2.9=29
\]
\[
60<m\le 75:\ 15\times 3.2=48
\]
\[
75<m\le 80:\ 5\times 2=10
\]
Add the estimates \[
19+36+32=87
\]
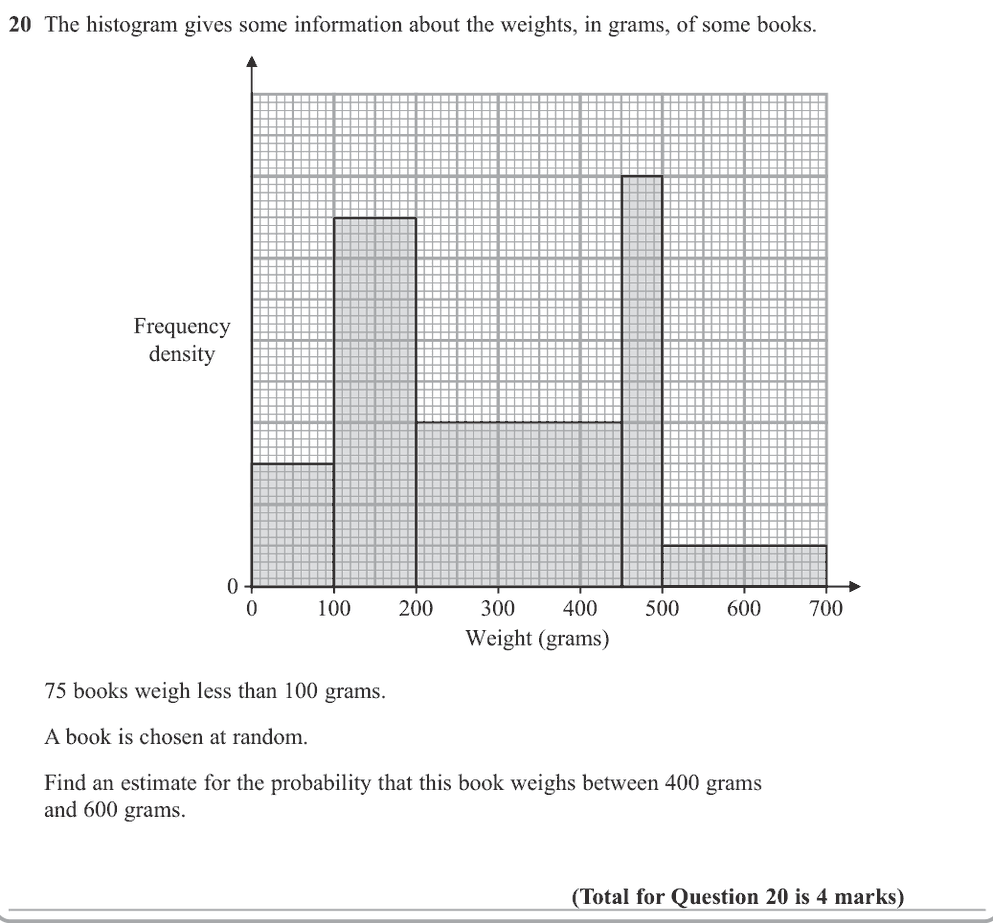
15. Jun 2025 P2HR · Q20 Medium 4 marksShow worked solution Use histogram For a histogram,
\[
\text{frequency}=\text{class width}\times \text{frequency density}
\]
Use frequency table For books weighing less than 100 g, the frequency is 75 and the class width is 100, so
\[
\text{frequency density}=\frac{75}{100}=0.75
\]
Use histogram Using this scale from the histogram, the frequency densities are:
\[
0.75,\ 2.25,\ 1.0,\ 2.5,\ 0.25
\]
The total number of books The total number of books is
\[
(100)(0.75)+(100)(2.25)+(250)(1.0)+(50)(2.5)+(200)(0.25)
\]
\[
=75+225+250+125+50=725
\]
Calculate value For weights between 400 g and 600 g:
\[
(50)(1.0)+(50)(2.5)+(100)(0.25)
\]
\[
=50+125+25=200
\]
Calculate probability So the probability is
\[
\frac{200}{725}=\frac{8}{29}
\]
Final answer \(\frac{8}{29}\) or \(0.276\) to 3 significant figures
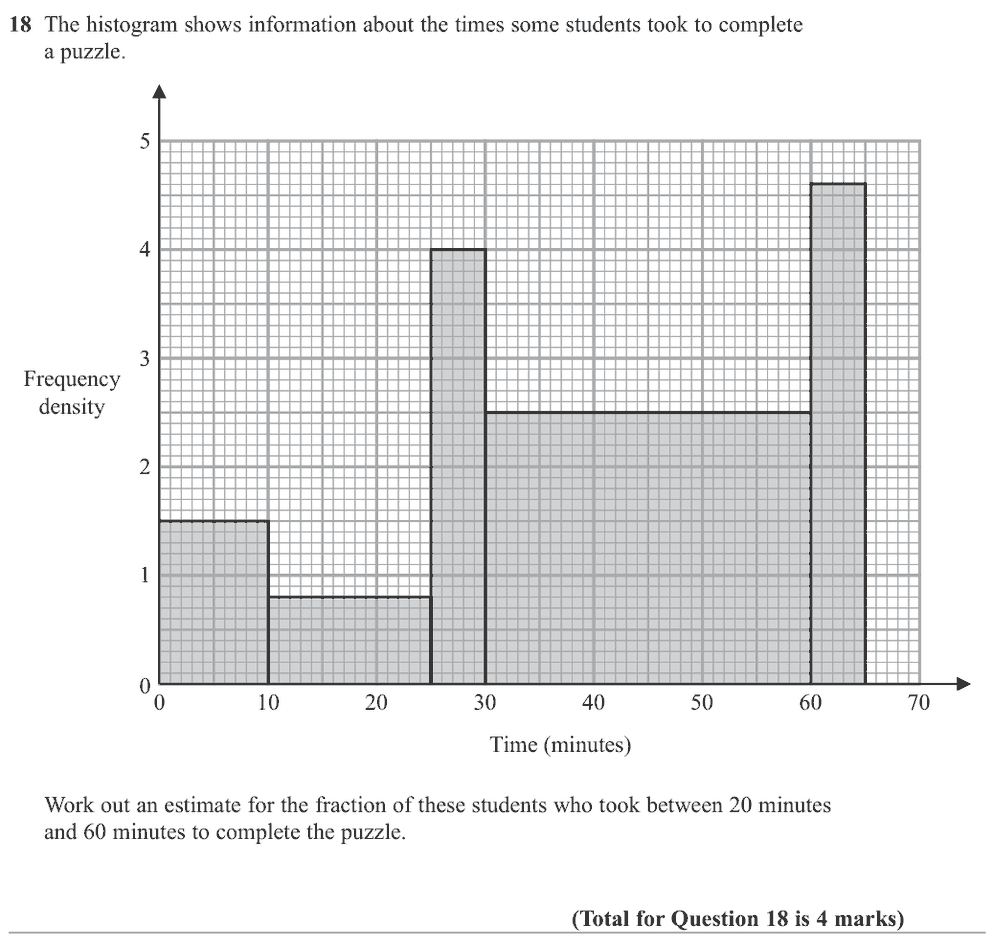
16. Nov 2024 P1H · Q18 Medium 4 marksShow worked solution Estimate the frequencies from each Estimate the frequencies from each bar:
\[
0\text{ to }10:\ 10(1.5)=15
\]
\[
10\text{ to }25:\ 15(0.8)=12
\]
\[
25\text{ to }30:\ 5(4)=20
\]
\[
30\text{ to }60:\ 30(2.5)=75
\]
\[
60\text{ to }65:\ 5(4.6)=23
\]
Total frequency Total frequency:
\[
15+12+20+75+23=145
\]
Between and minutes Between \(20\) and \(60\) minutes:
\[
5(0.8)+20+75=99
\]
\[
\text{fraction}=\frac{99}{145}
\]
Final answer \(\frac{99}{145}\).
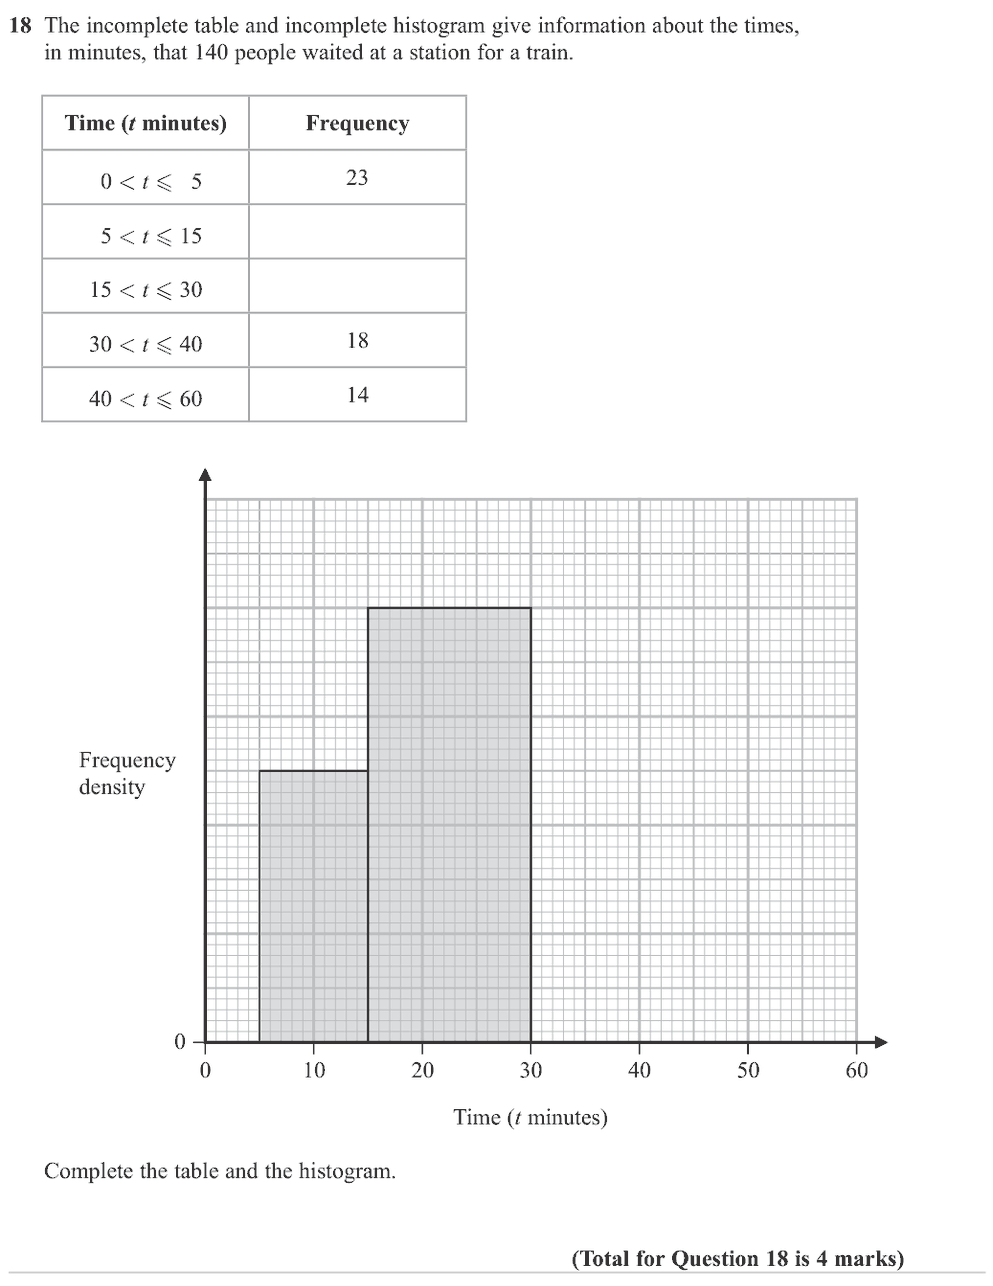
17. May 2023 P1H · Q18 Medium 4 marksShow worked solution The total frequency is The total frequency is \(140\).
The known frequencies are \[
23+18+14=55
\]
Use histogram So the two missing frequencies have total
\[
140-55=85
\]
Use histogram From the histogram, the missing frequencies are
\[
5<t\le 15:\ 25,\qquad 15<t\le 30:\ 60
\]
The missing histogram densities are \[
0<t\le 5:\frac{23}{5}=4.6
\]
\[
30<t\le 40:\frac{18}{10}=1.8
\]
\[
40<t\le 60:\frac{14}{20}=0.7
\]
Final answer missing frequencies \(25,60\), and missing densities \(4.6,1.8,0.7\).
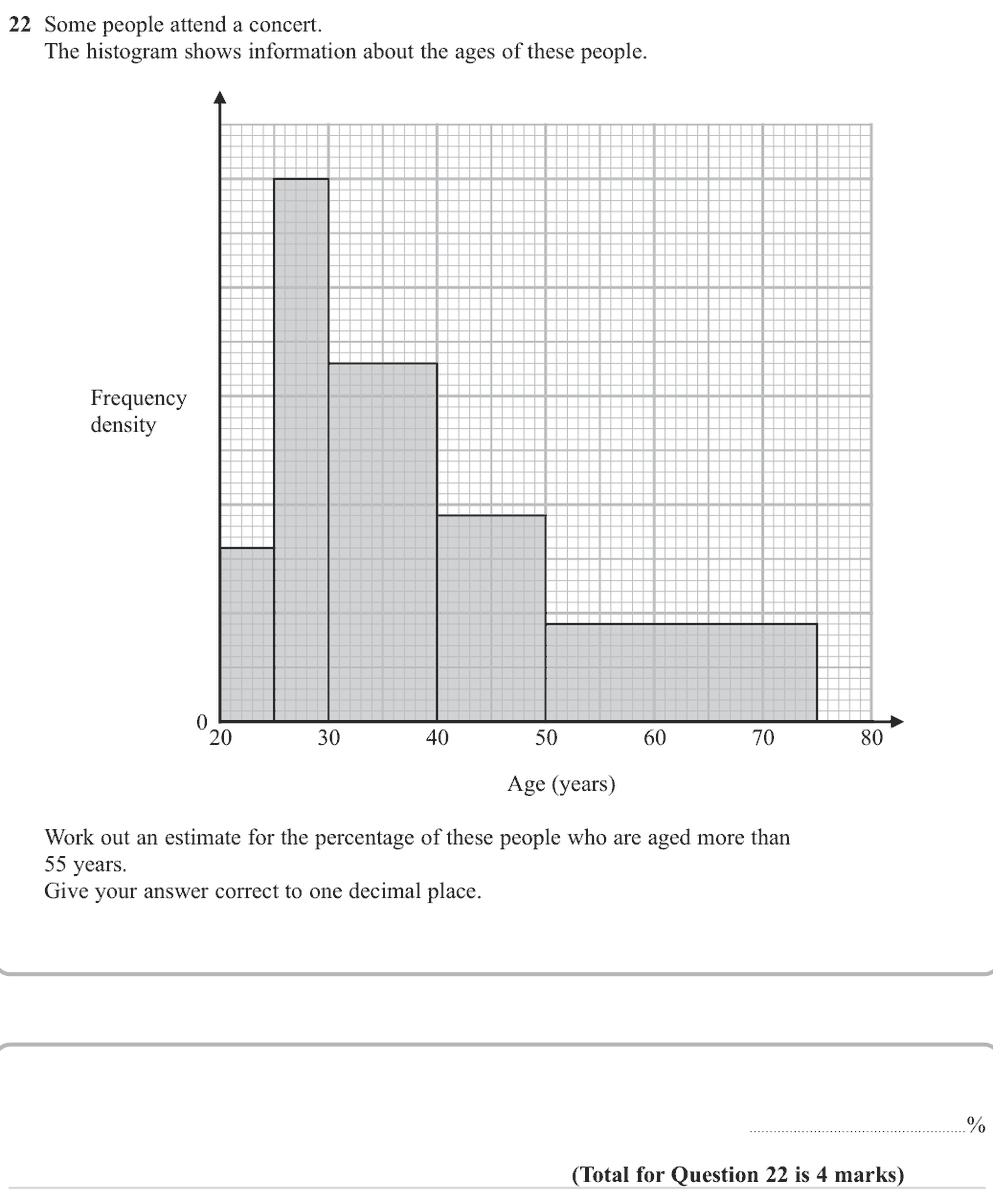
18. May 2023 P1HR · Q22 Medium 4 marksShow worked solution The scale of the frequency The scale of the frequency density axis is not needed because the percentage is found from areas.
Calculate area Using the bar heights from the histogram, the relative areas are:
\[
(5)(277)+(5)(866)+(10)(571)+(10)(329)+(25)(155)
\]
\[
=1385+4330+5710+3290+3875
\]
\[
=18590
\]
Calculate value For ages more than 55, use the part of the last bar from 55 to 75:
\[
(20)(155)=3100
\]
Calculate percentage So the estimated percentage is
\[
\frac{3100}{18590}\times100=16.675\ldots
\]
19. Jan 2022 P2H · Q20 Medium 4 marksShow worked solution Use histogram For a histogram,
\[
\text{frequency}=\text{class width}\times \text{frequency density}
\]
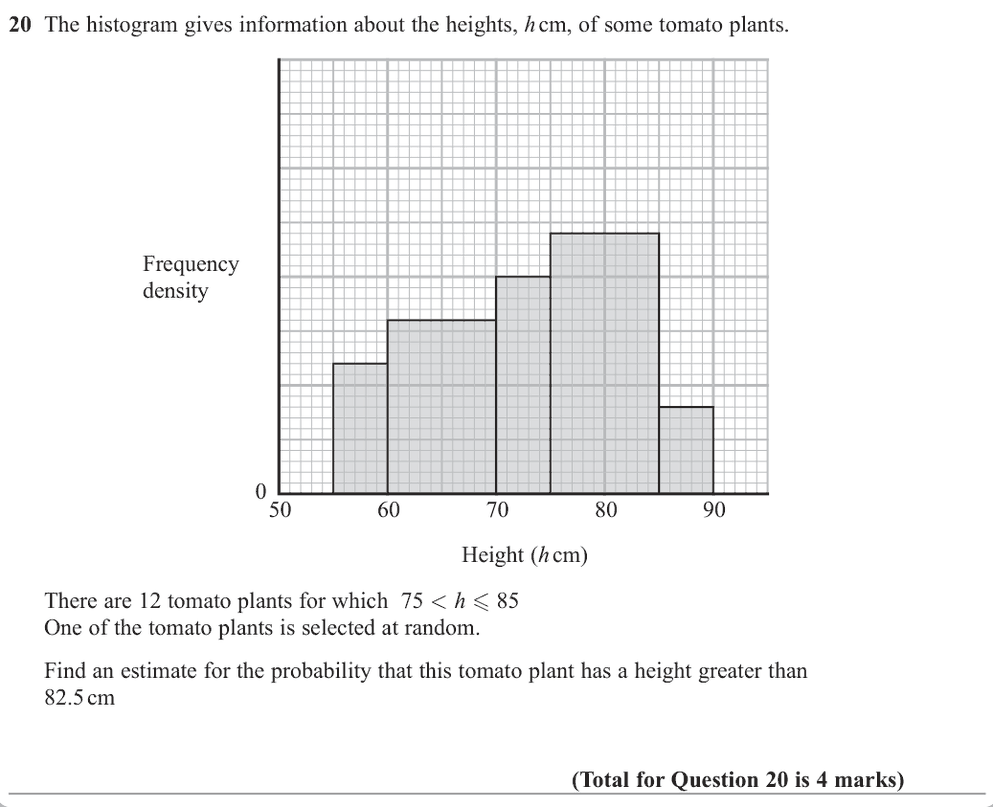
Use frequency table For \(75<h\leq85\), the frequency is 12 and the class width is 10, so
\[
\text{frequency density}=\frac{12}{10}=1.2
\]
Use histogram Using this scale from the histogram, the frequency densities are:
\[
0.6,\ 0.8,\ 1.0,\ 1.2,\ 0.4
\]
The total number of tomato The total number of tomato plants is
\[
(5)(0.6)+(10)(0.8)+(5)(1.0)+(10)(1.2)+(5)(0.4)
\]
\[
=3+8+5+12+2=30
\]
Solve inequality For \(h>82.5\):
\[
(2.5)(1.2)+(5)(0.4)=3+2=5
\]
Calculate probability So the probability is
\[
\frac{5}{30}=\frac16
\]
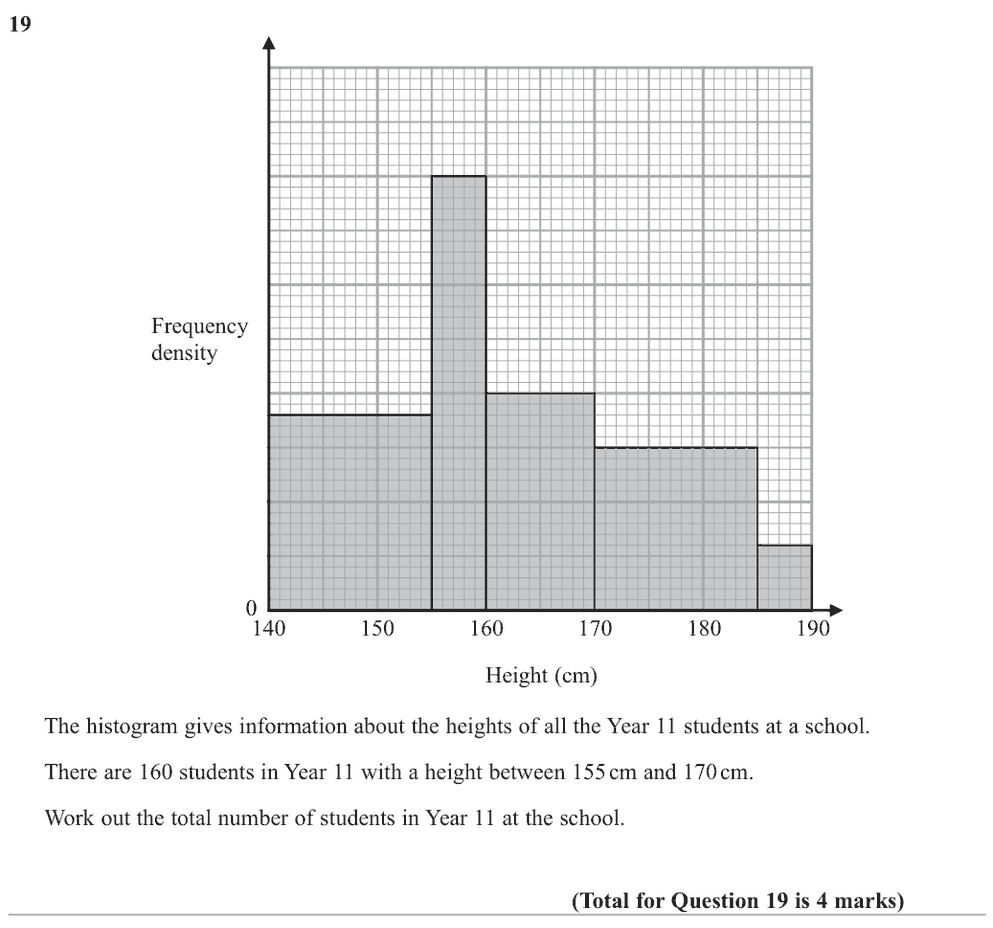
20. Jan 2020 P1HR · Q19 Medium 4 marksShow worked solution Use the relative histogram heights Use the relative histogram heights.
Calculate area For \(155<h\le 170\), the relative area is
\[
5(40)+10(20)=400
\]
Calculate area This represents \(160\) students, so each relative area unit represents
\[
\frac{160}{400}=0.4
\]
Total relative area Total relative area:
\[
15(18)+5(40)+10(20)+15(15)+5(6)=925
\]
Estimated total Estimated total:
\[
925 \times 0.4=370
\]
Final answer \(370\) students.
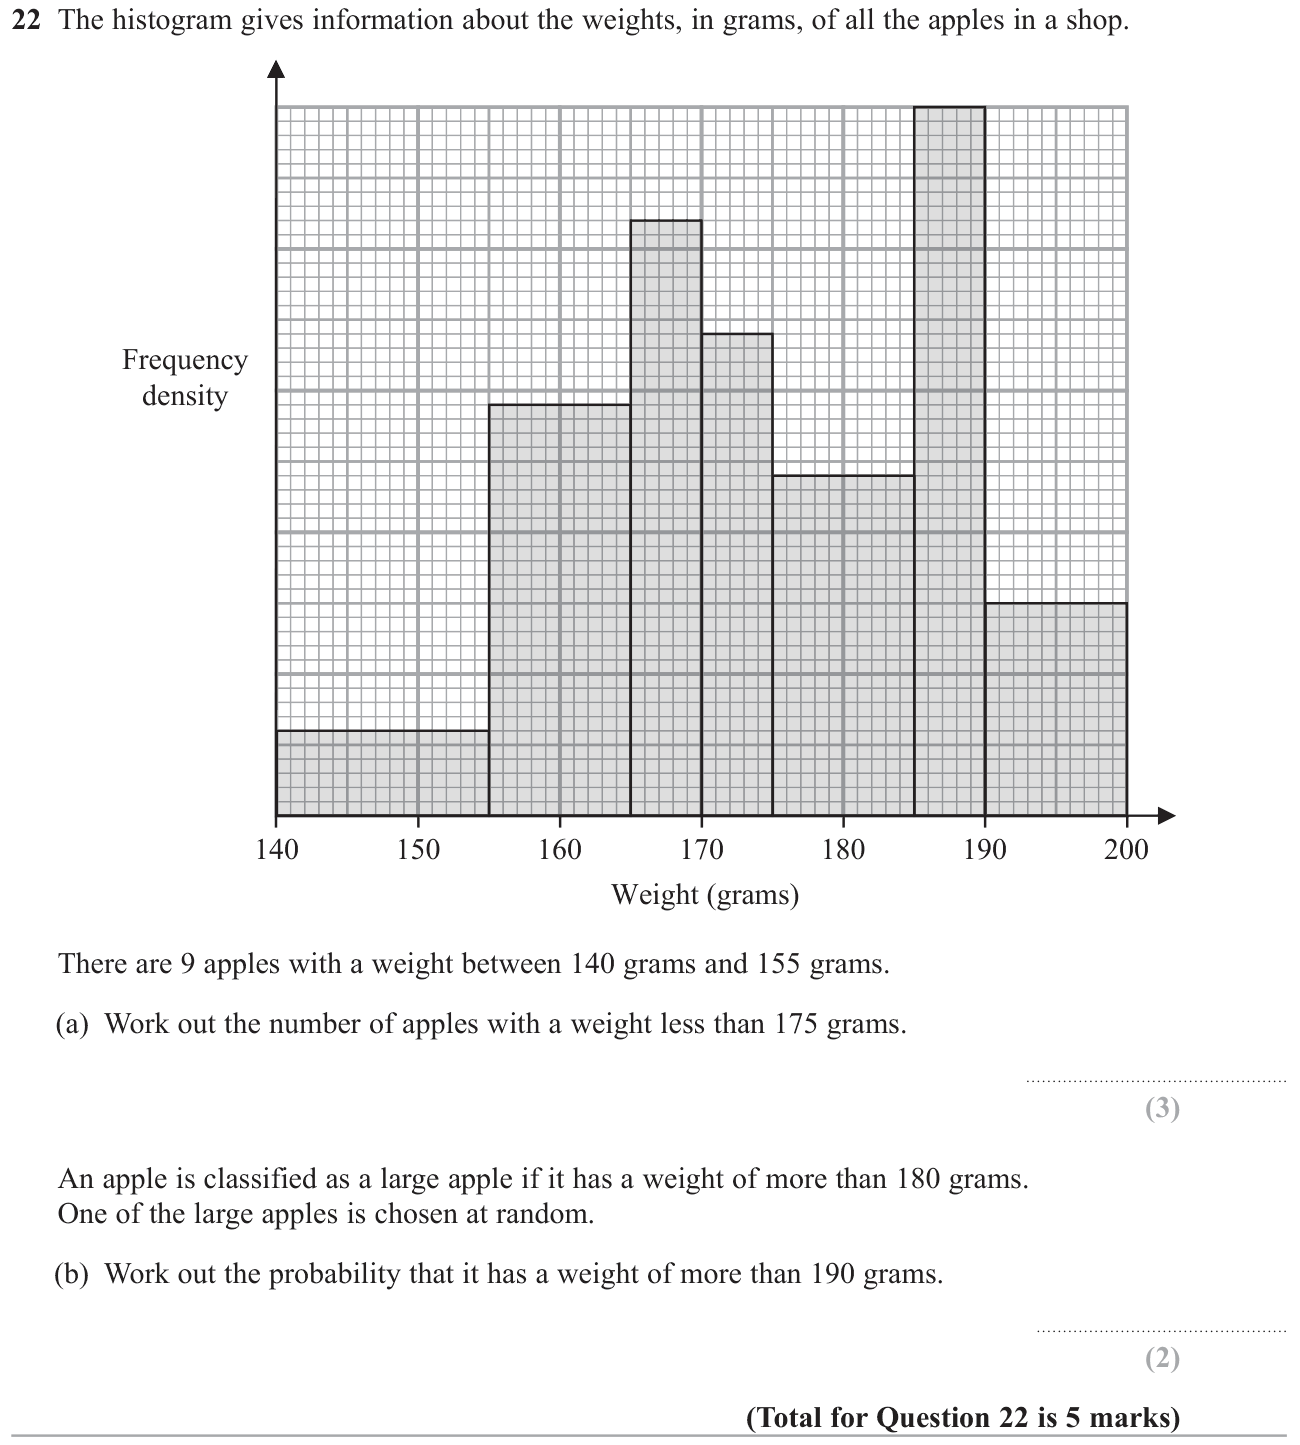
21. Jun 2026 P1H · Q22 Hard 5 marksShow worked solution Part (a) | Step 1 The first class has width 15 g and frequency 9, so its density is \(9/15=0.6\). Its height is 6 small grid squares, so each vertical square represents density \(0.1\).
Frequency is class width multiplied by frequency density.
Part (a) | Step 2 The classes below 175 g have densities \(0.6,2.9,4.2,3.4\) and widths \(15,10,5,5\), respectively.
Read the bar heights using the calibrated vertical scale.
Part (a) | Step 3 \[N=15(0.6)+10(2.9)+5(4.2)+5(3.4)=9+29+21+17=76.\]
Add the frequencies, not the heights.
Part (b) | Step 1 Above 180 g, the frequency from 180 to 185 is \(5(2.4)=12\), from 185 to 190 is \(5(5)=25\), and from 190 to 200 is \(10(1.5)=15\).
Use only half of the 175-185 bar and all of the two heavier classes.
Part (b) | Step 2 \[P(W>190\mid W>180)=\frac{15}{12+25+15}=\frac{15}{52}.\]
Restrict the denominator to the large apples.
Final answer (a) \(76\text{ apples}\)
(b) \(15/52\)
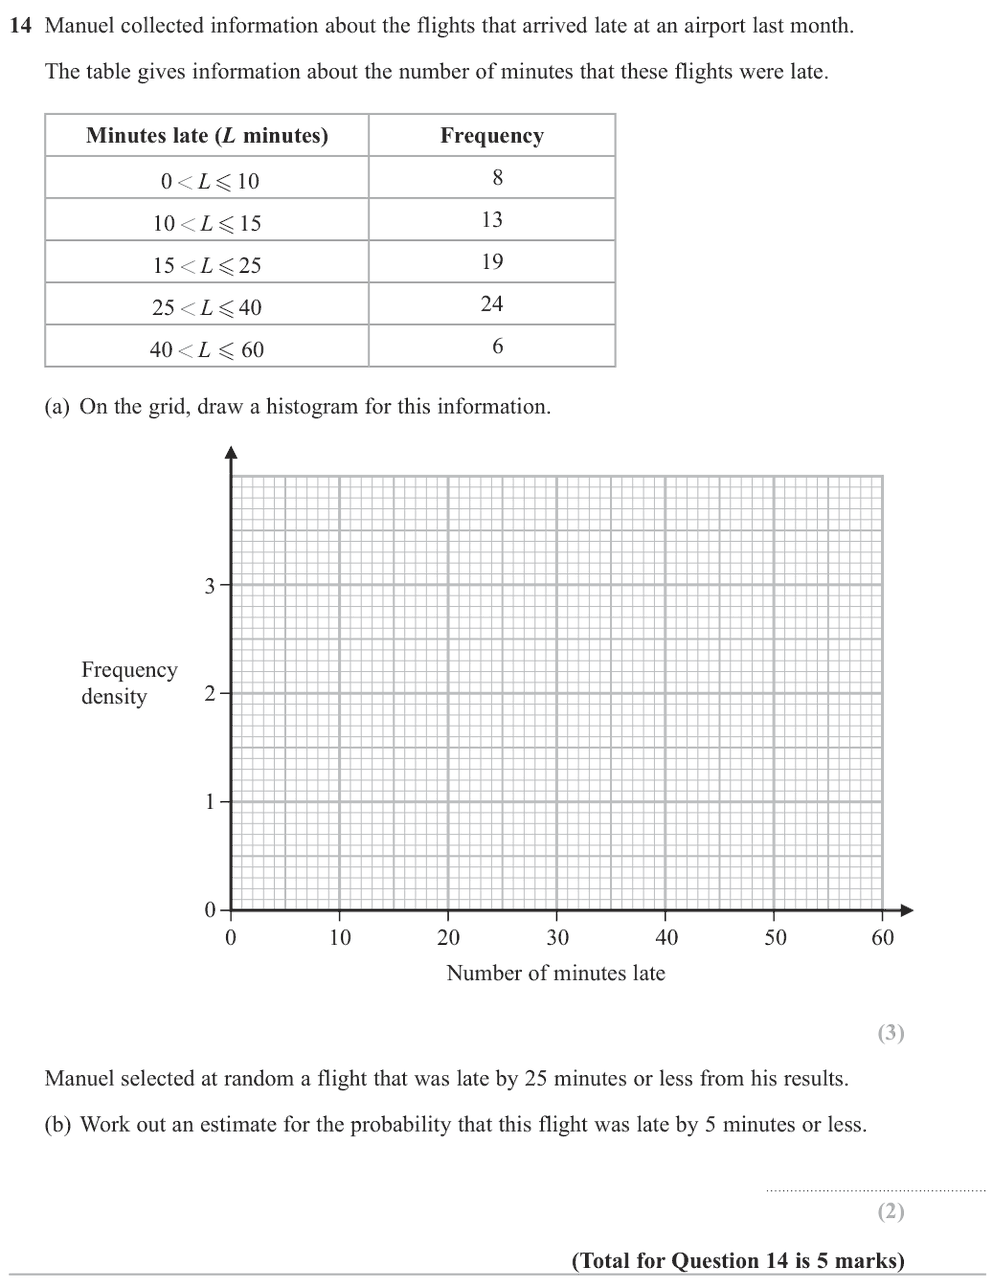
22. Nov 2021 P2H · Q14 Hard 5 marksShow worked solution The histogram densities are \[
0<L\le 10:\frac{8}{10}=0.8
\]
\[
10<L\le 15:\frac{13}{5}=2.6
\]
\[
15<L\le 25:\frac{19}{10}=1.9
\]
\[
25<L\le 40:\frac{24}{15}=1.6
\]
\[
40<L\le 60:\frac{6}{20}=0.3
\]
Use histogram Given \(L\le 25\), the total frequency is
\[
8+13+19=40
\]
Use histogram For \(L\le 5\), estimate half of the first class:
\[
5(0.8)=4
\]
\[
P(L\le 5\mid L\le 25)=\frac{4}{40}=\frac{1}{10}
\]
Final answer histogram densities \(0.8,2.6,1.9,1.6,0.3\), and probability \(\frac{1}{10}\).
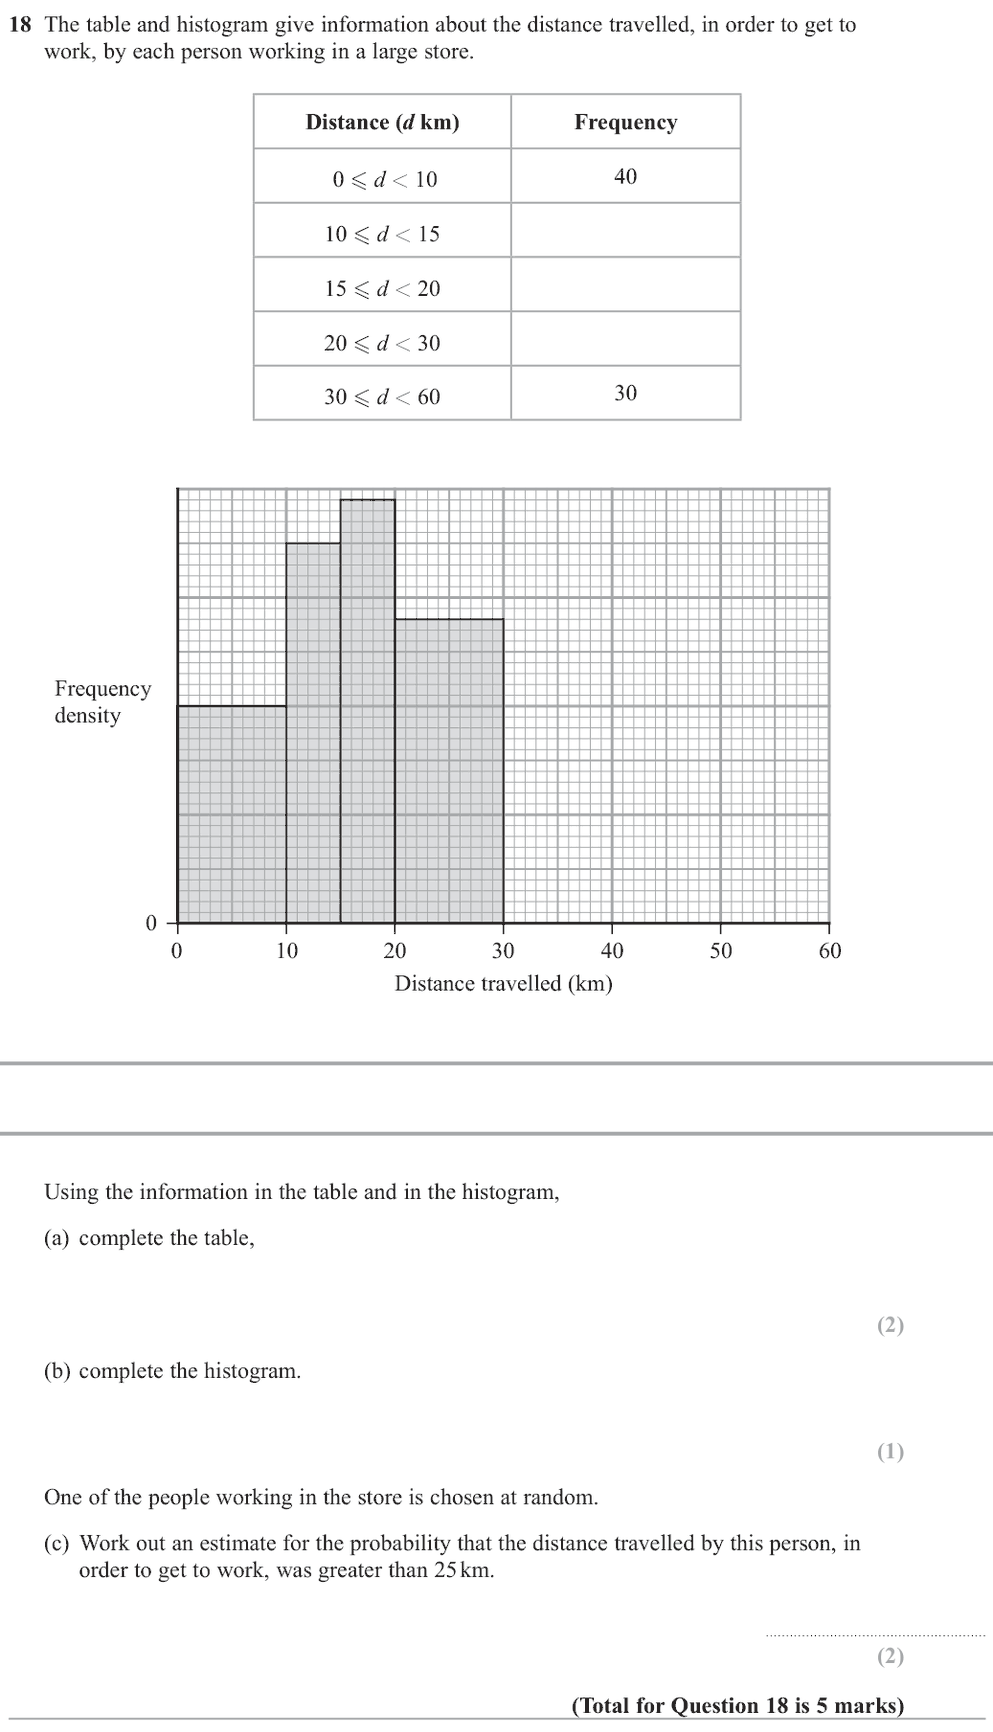
23. May 2021 P1H · Q18 Hard 5 marksShow worked solution Use histogram The \(0\le d<10\) class has frequency \(40\), so its density is
\[
\frac{40}{10}=4
\]
Use histogram From the histogram, the missing frequencies are
\[
10\le d<15:\ 35,\qquad 15\le d<20:\ 40,\qquad 20\le d<30:\ 60
\]
Together with the table Together with the table:
\[
40+35+40+60+30=205
\]
Use histogram For \(d>25\):
\[
5(6)+30=60
\]
\[
P(d>25)=\frac{60}{205}=\frac{12}{41}
\]
Final answer completed frequencies \(35,40,60\), missing histogram density \(1\), and probability \(\frac{12}{41}\).
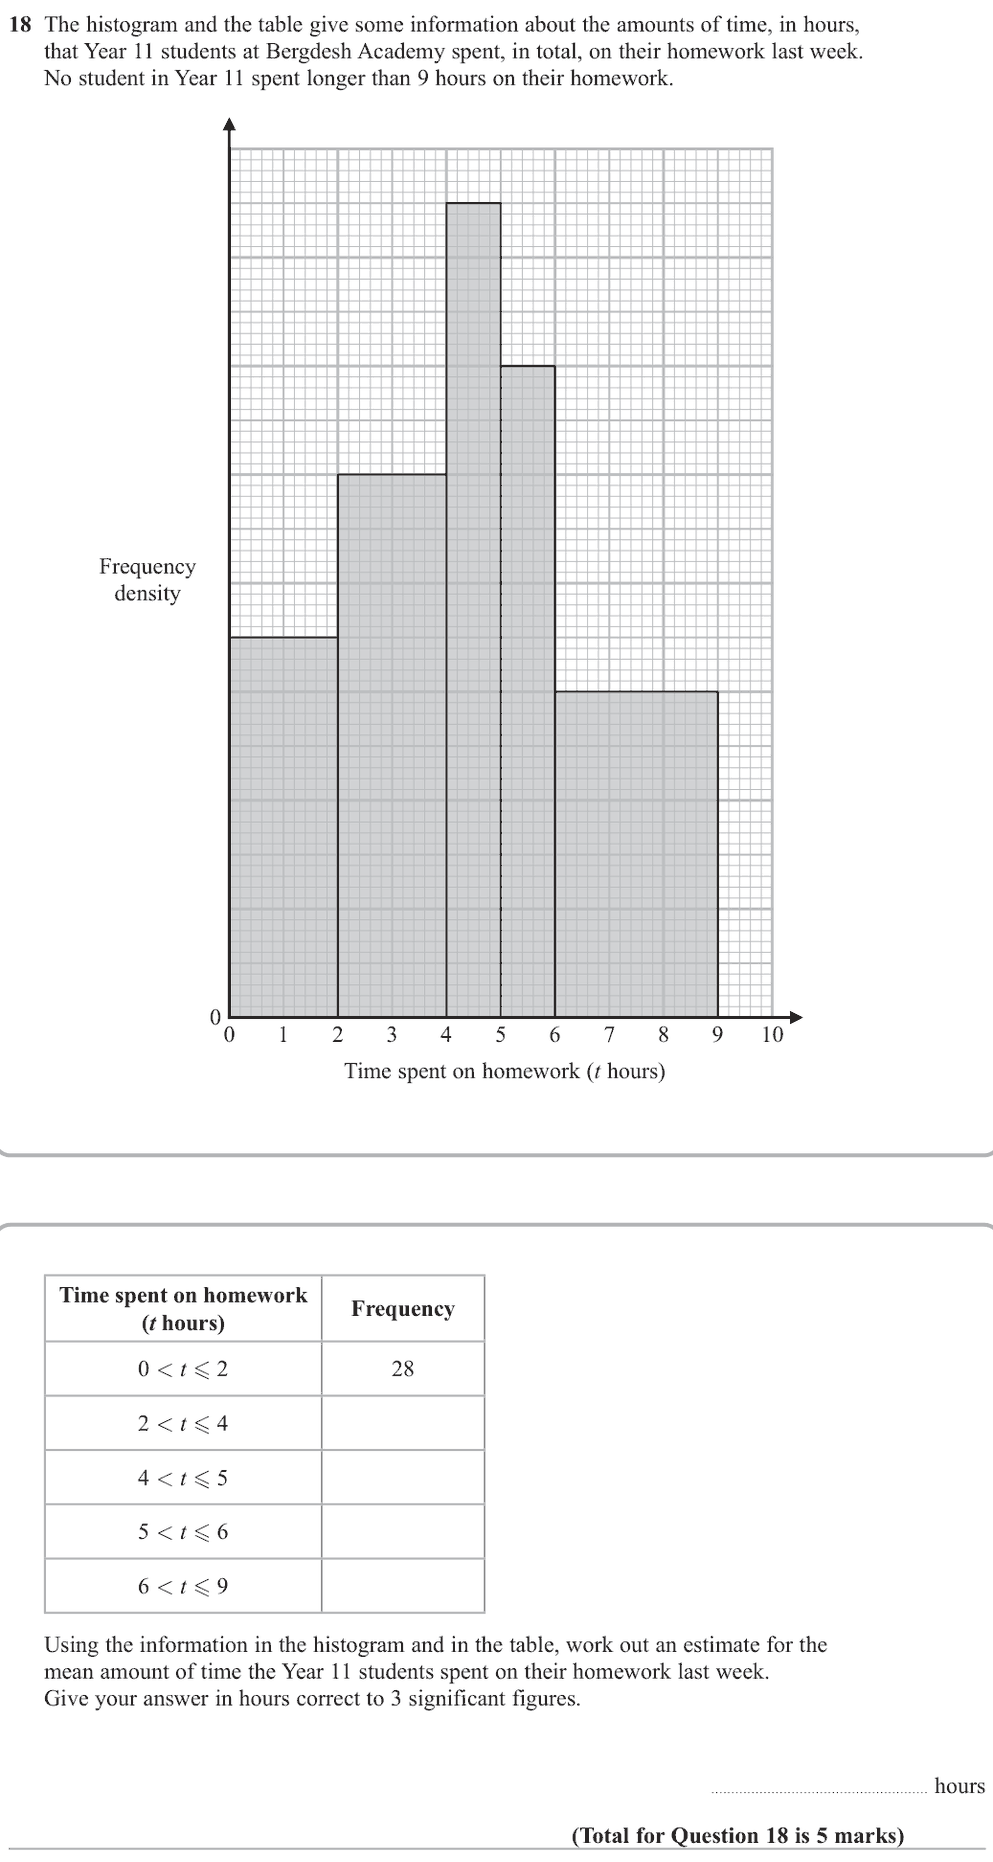
24. Jan 2021 P1HR · Q18 Hard 5 marksShow worked solution Use histogram The \(0<t\le 2\) class has frequency \(28\). From the histogram, the relative heights are
\[
1,\ 4,\ 9,\ 6,\ 1
\]
Use histogram So the frequencies are
\[
28,\ 112,\ 126,\ 84,\ 42
\]
Use midpoints Use midpoints \(1,3,4.5,5.5,7.5\).
\[
\text{total frequency}=28+112+126+84+42=392
\]
\[
\text{estimated total}=1(28)+3(112)+4.5(126)+5.5(84)+7.5(42)=1708
\]
\[
\text{mean}=\frac{1708}{392}=4.357\ldots
\]
Final answer \(4.36\) hours.
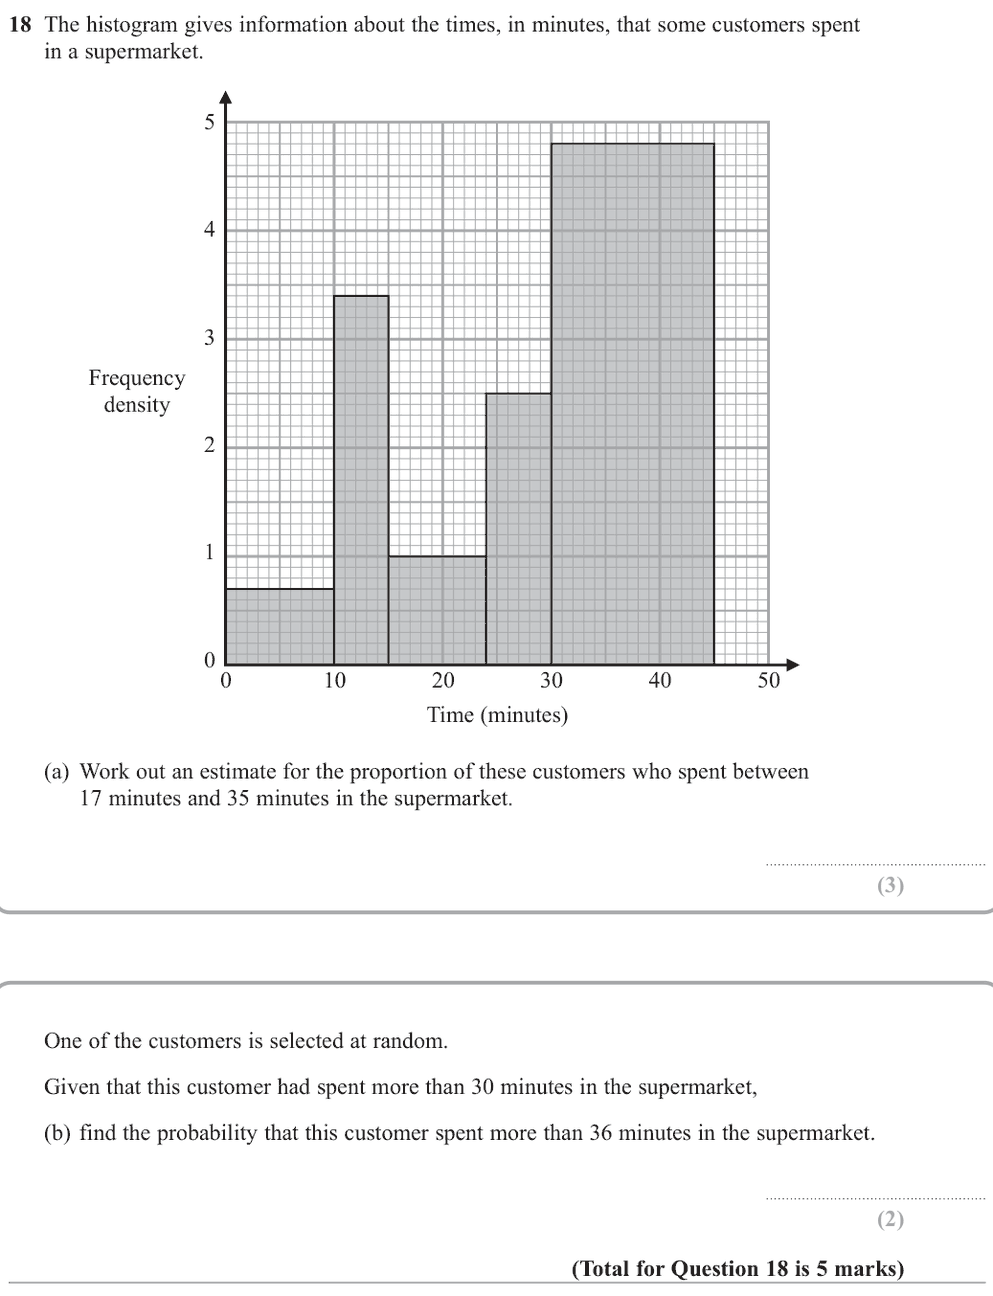
25. Jan 2020 P2H · Q18 Hard 5 marksShow worked solution Total frequency Total frequency:
\[
10(0.7)+5(3.4)+9(1)+6(2.5)+15(4.8)=120
\]
Between 17 and 35 minutes Between 17 and 35 minutes:
\[
7(1)+6(2.5)+5(4.8)=46
\]
\[
\text{proportion}=\frac{46}{120}=\frac{23}{60}
\]
Given the customer spent more Given the customer spent more than 30 minutes, they are in the \(30\) to \(45\) minute class.
More than 36 minutes is More than 36 minutes is \(9\) minutes out of the \(15\)-minute class:
\[
\frac{9}{15}=\frac35
\]
Final answer \(\frac{23}{60}\), then \(\frac35\).
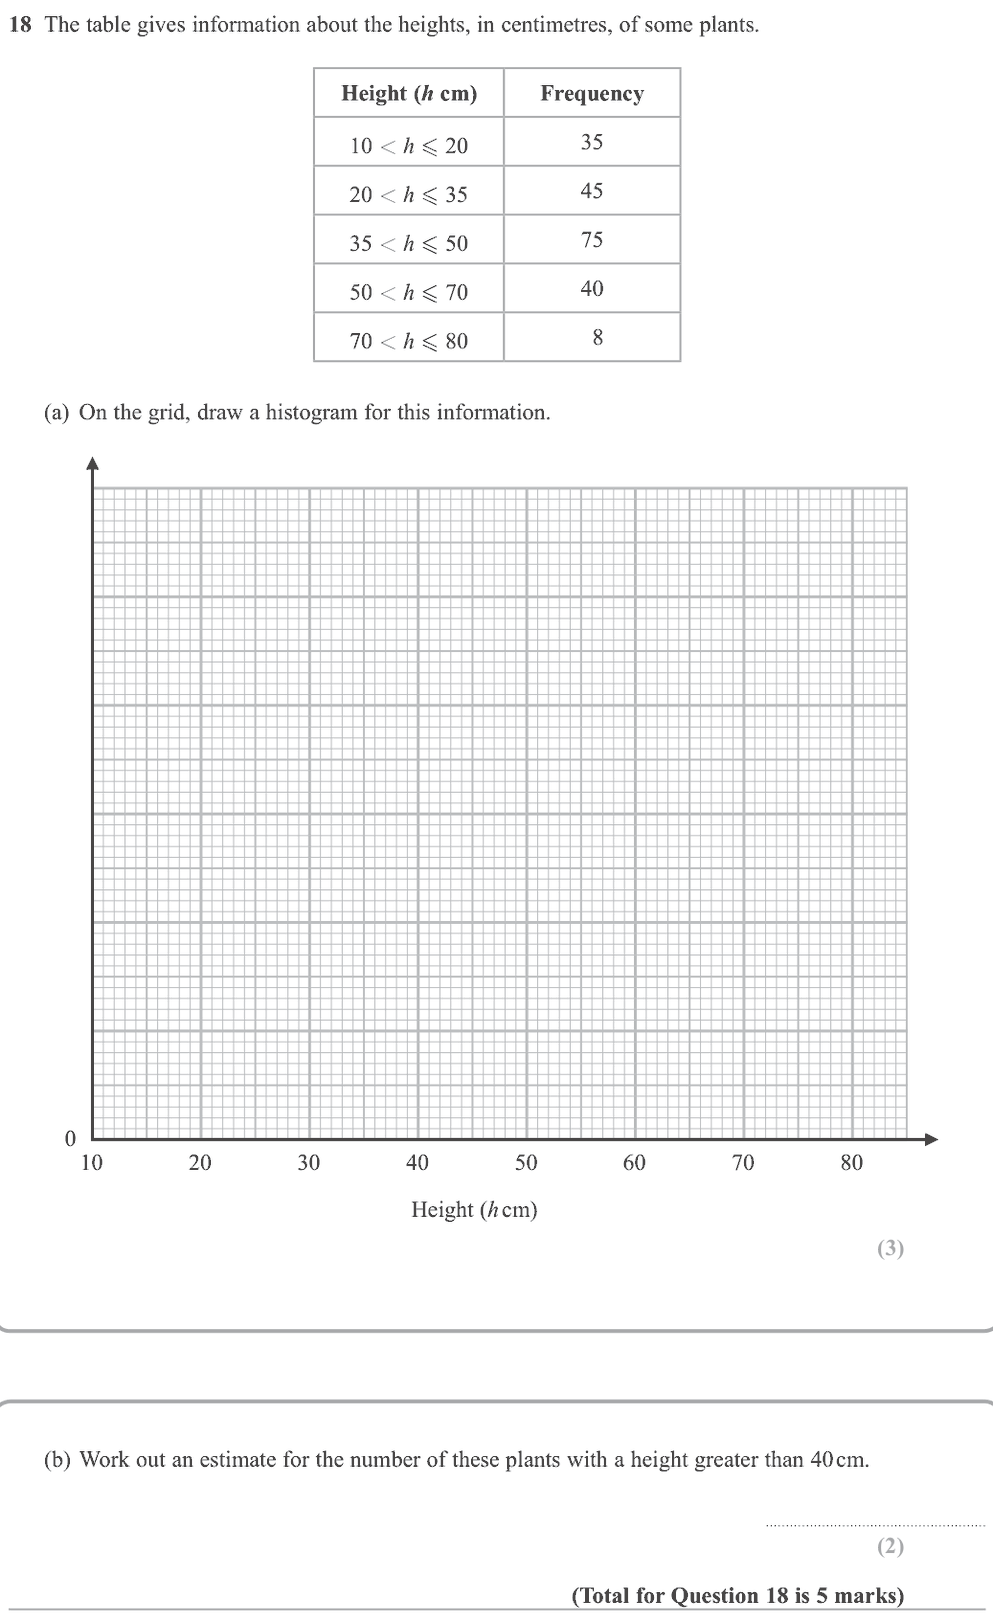
26. May-Nov 2020 P1H · Q18 Hard 5 marksShow worked solution The histogram densities are \[
\frac{35}{10}=3.5,\quad
\frac{45}{15}=3,\quad
\frac{75}{15}=5,\quad
\frac{40}{20}=2,\quad
\frac{8}{10}=0.8
\]
Use histogram For plants taller than \(40\text{ cm}\):
Use histogram From \(40<h\le 50\):
\[
10(5)=50
\]
Use histogram From \(50<h\le 70\):
\[
40
\]
Use histogram From \(70<h\le 80\):
\[
8
\]
\[
50+40+8=98
\]
Final answer draw bars with densities \(3.5,3,5,2,0.8\), and \(98\) plants.
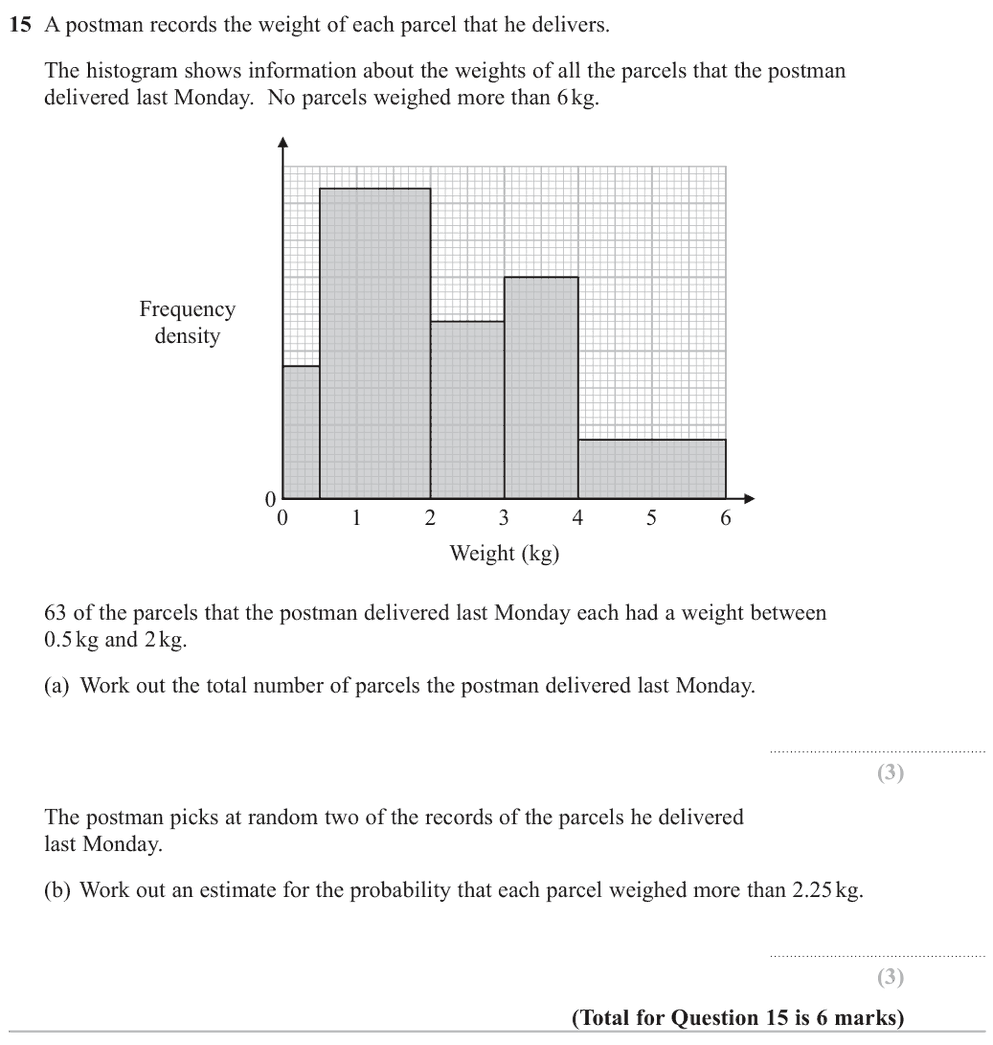
27. Jan 2021 P2H · Q15 Hard 6 marksShow worked solution Use histogram For \(0.5<w\le 2\), the frequency is \(63\), so the density is
\[
\frac{63}{1.5}=42
\]
Use histogram Using the histogram heights, the class frequencies are
\[
9,\ 63,\ 24,\ 30,\ 16
\]
Use histogram So the total number of parcels is
\[
9+63+24+30+16=142
\]
Use histogram For weight greater than \(2.25\text{ kg}\):
\[
0.75(24)+30+16=64
\]
The probability that both randomly The probability that both randomly chosen records are greater than \(2.25\text{ kg}\) is
\[
\frac{64}{142}\times \frac{63}{141}=0.201\ldots
\]
Final answer \(142\), then \(0.201\) approximately.
More IGCSE Maths 4MA1 topics Dr Eslam Ahmed Elite Mathematics · Questions classified by topic, solutions checked by Dr Eslam
 Elite Mathematics