Cumulative Frequency: past paper questions & worked solutions
Every Cumulative Frequency question from the 4MA1 papers in our bank, 2020–2026, sorted from easiest to hardest. Try each one first, then open the worked solution.
Level is estimated from marks: 1–2 easy, 3–4 medium, 5+ hard.
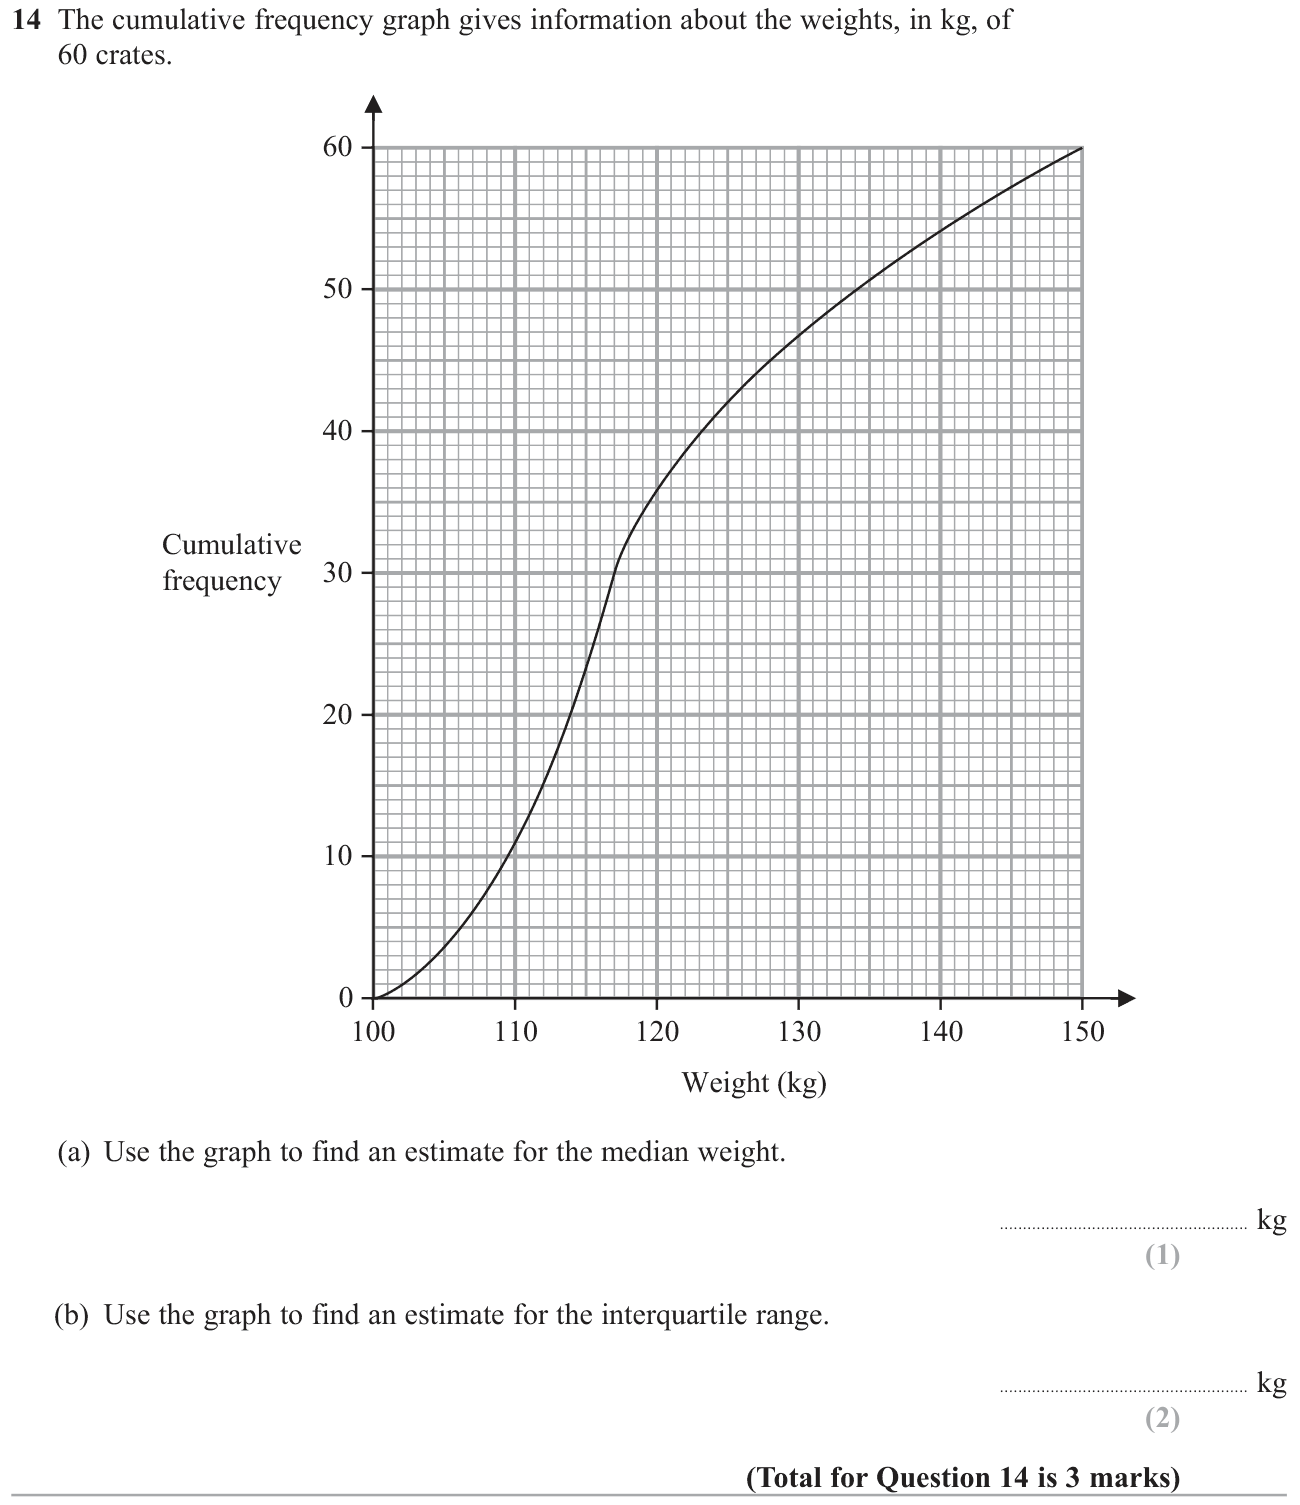
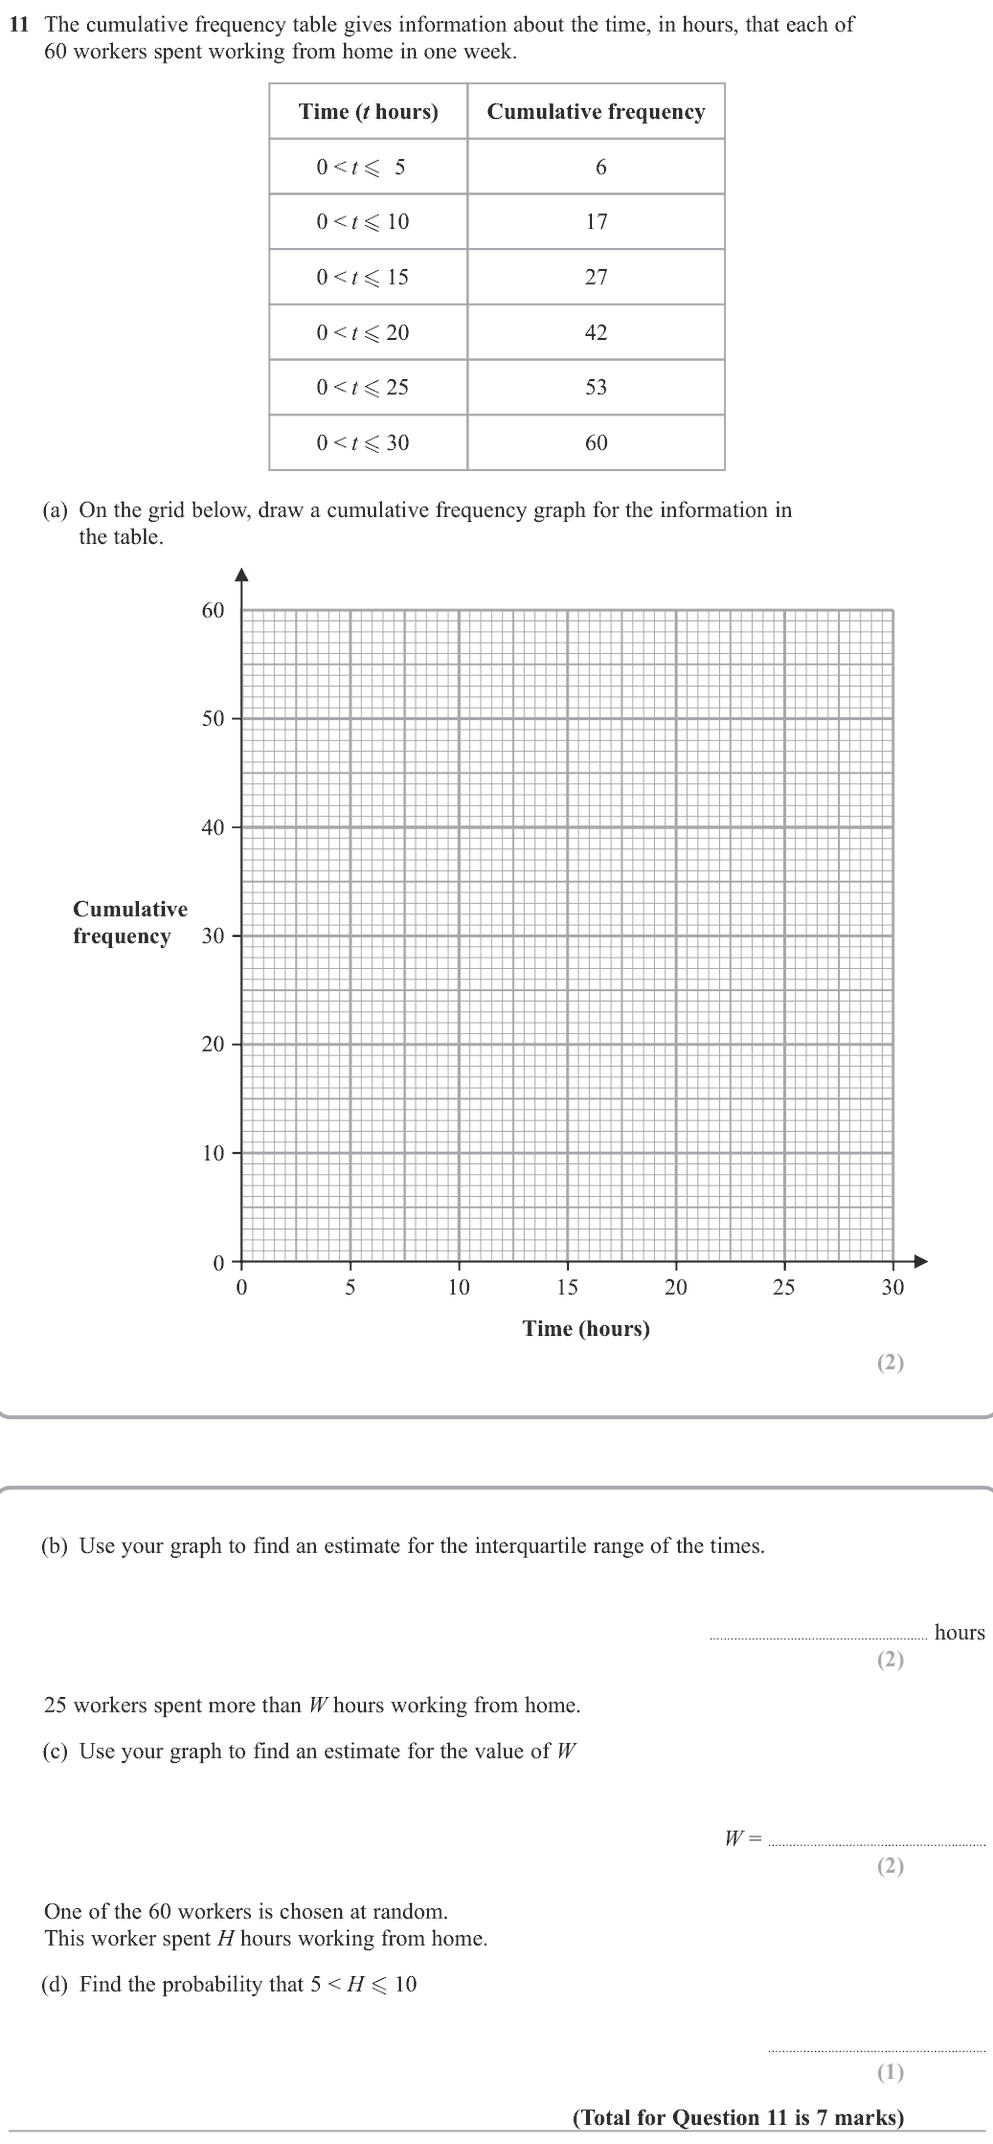
1. Jun 2026 P2H · Q14
Medium3 marksShow worked solution
Part (a) | Step 1
The median is the \(60/2=30\)th value. Draw horizontally from cumulative frequency \(30\) to the curve, then vertically to the weight axis: about \(117\text{ kg}\).
The median splits the 60 observations in half.
Part (b) | Step 1
Read the lower quartile at cumulative frequency \(60/4=15\), giving \(Q_1\approx112\text{ kg}\). Read the upper quartile at cumulative frequency \(3(60)/4=45\), giving \(Q_3\approx128\text{ kg}\).
Quartiles occur at one-quarter and three-quarters of the total frequency.
Interquartile range is upper quartile minus lower quartile.
Final answer
(a) \(117\text{ kg}\) approximately.
(b) \(16\text{ kg}\) approximately.
2. Jun 2026 P1HR · Q14
Medium4 marksShow worked solution
Part (a) | Step 1
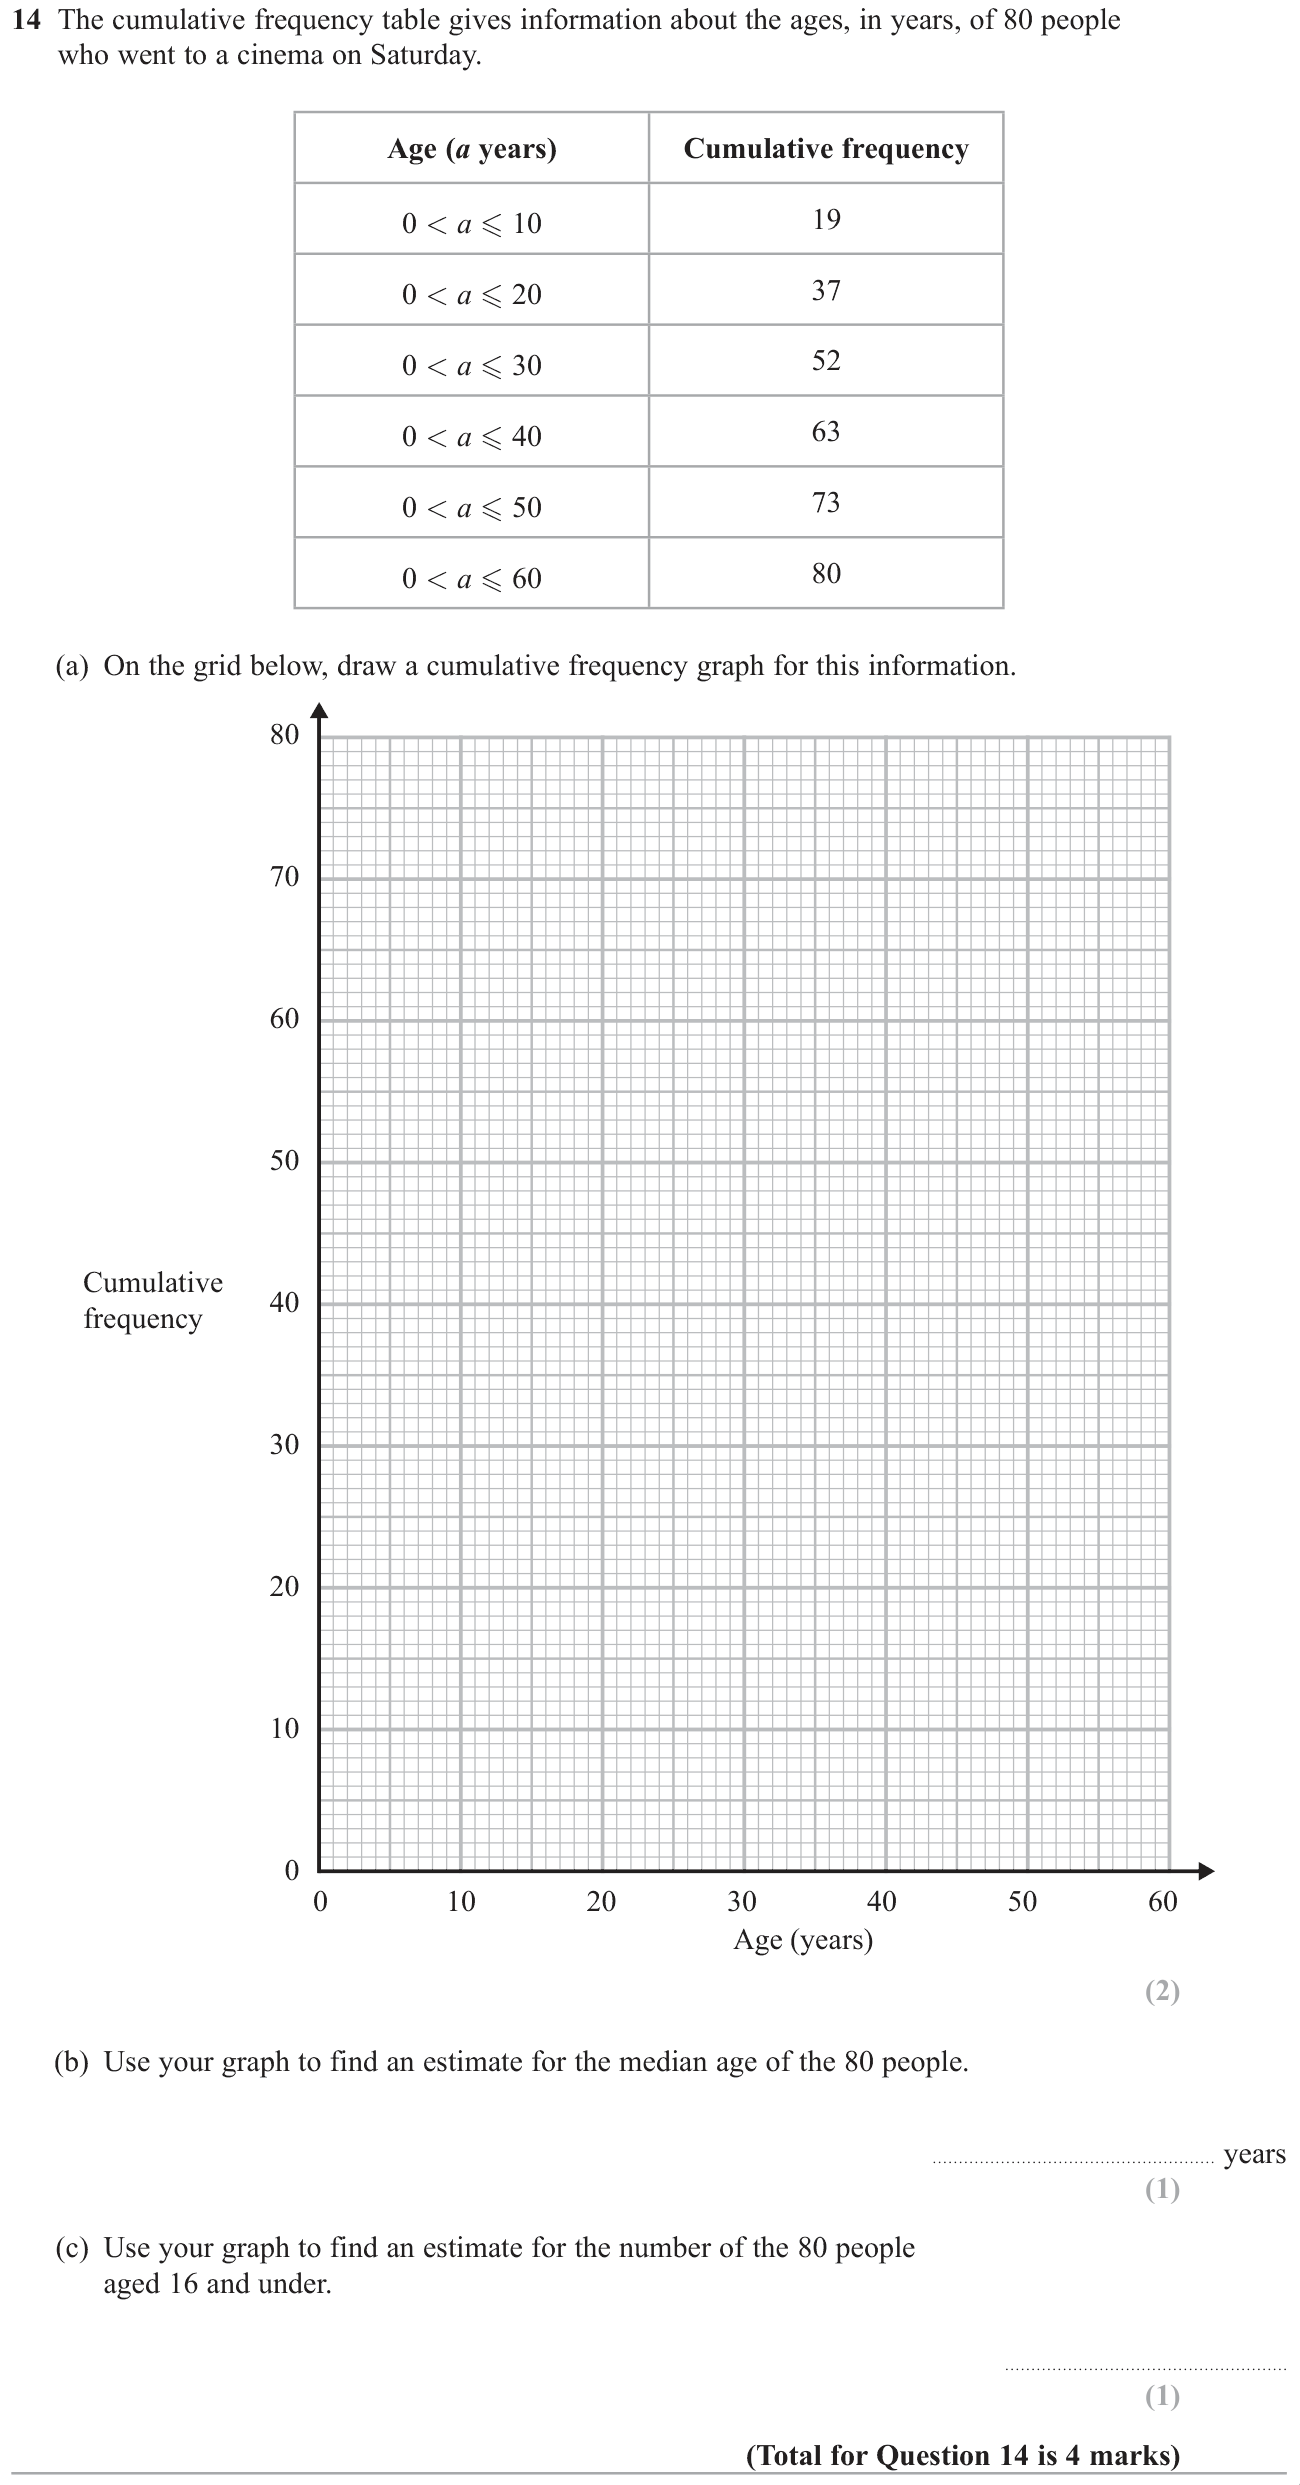
Use age (years) on the horizontal axis from \(0\) to \(60\), and cumulative frequency on the vertical axis from \(0\) to \(80\). Plot \((0,0),(10,19),(20,37),(30,52),(40,63),(50,73),(60,80)\).
Each cumulative total is plotted at its upper age boundary.
Part (a) | Step 2
Join the points in order with an increasing curve or straight line segments. Do not draw bars or a staircase.
This represents the accumulated number up to each age boundary.
Part (b) | Step 1
\[\text{median position}=\frac{80}{2}=40.\]
Read horizontally from cumulative frequency 40 to the graph, then vertically down to the age axis.
Part (b) | Step 2
Using straight segments, \[20+\frac{40-37}{52-37}\times10=22\text{ years}.\]
The median is estimated between ages 20 and 30; a smooth graph gives a nearby estimate.
Part (c) | Step 1
Read vertically from age \(16\) to the graph, then horizontally to the cumulative-frequency axis.
The ordinate is the estimated number aged 16 and under.
Part (c) | Step 2
Using straight segments, \[19+\frac{16-10}{20-10}(37-19)=29.8\approx30.\]
Round the estimated count to a whole number of people.
Final answer
(a) Increasing cumulative-frequency graph through \((0,0),(10,19),(20,37),(30,52),(40,63),(50,73),(60,80)\).
(b) Approximately \(22\) years.
(c) Approximately \(30\) people.
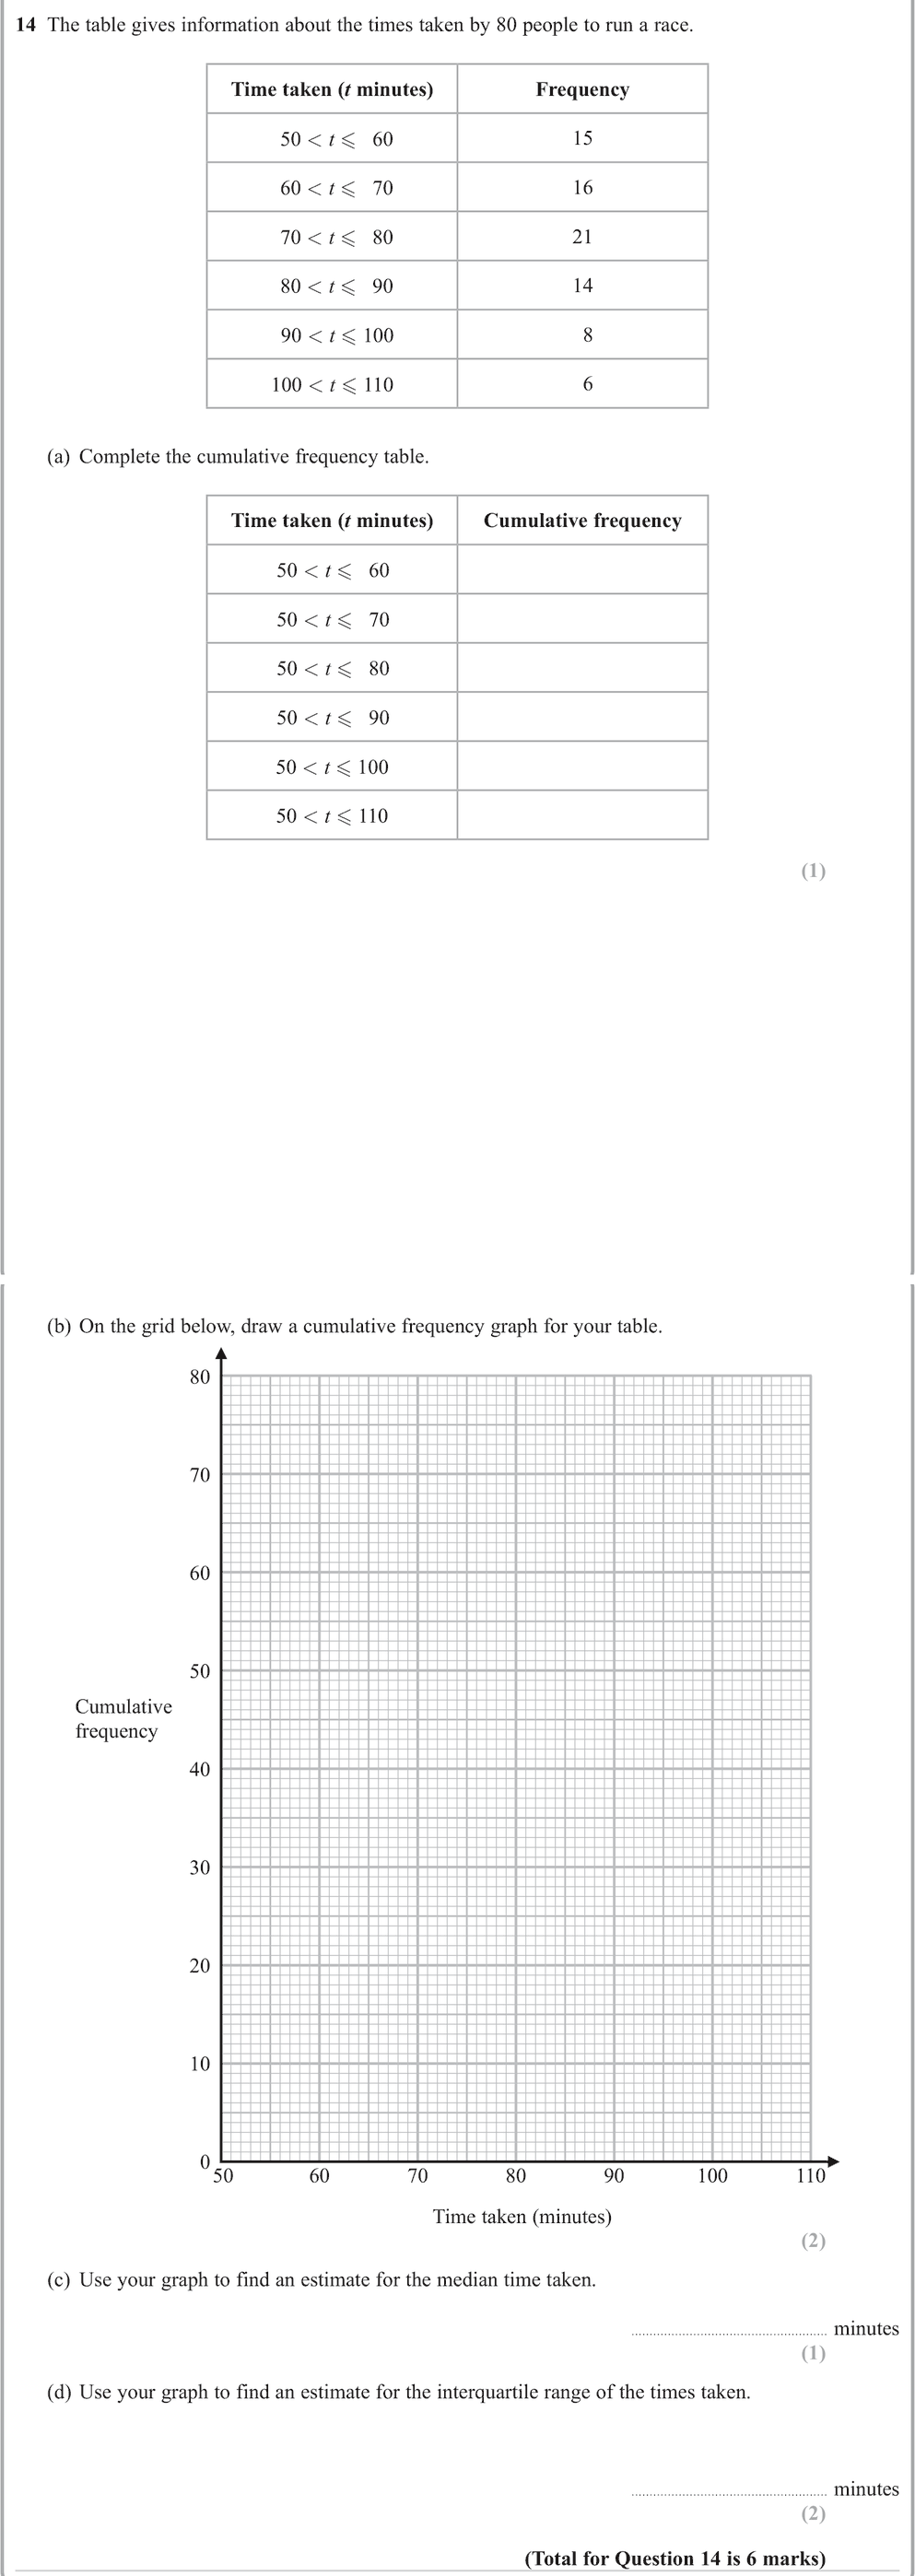
3. Nov 2023 P1H · Q13
Medium4 marksShow worked solution
(a) Median
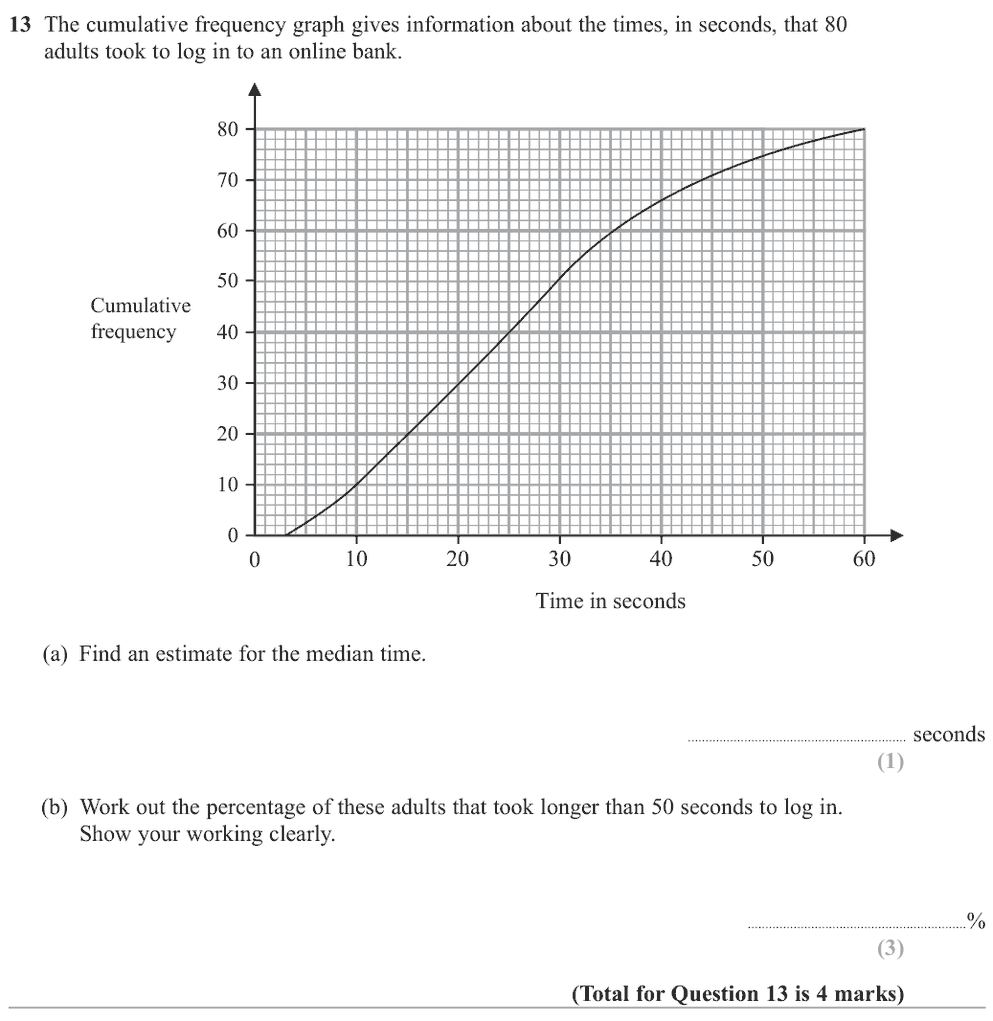
Read across from \(\frac{80}{2}=40\): about \(25\) seconds.
(b) Adults who took longer than 50 seconds
At \(50\) seconds the curve reads about \(75\), so \(80-75=5\) adults.
(b) Percentage
\[
\frac{5}{80}\times100=6.25\%
\]
Final answer
(a) about \(25\) seconds (b) about \(6.25\%\)
4. May 2023 P1H · Q12
Medium4 marksShow worked solution
(a) Median
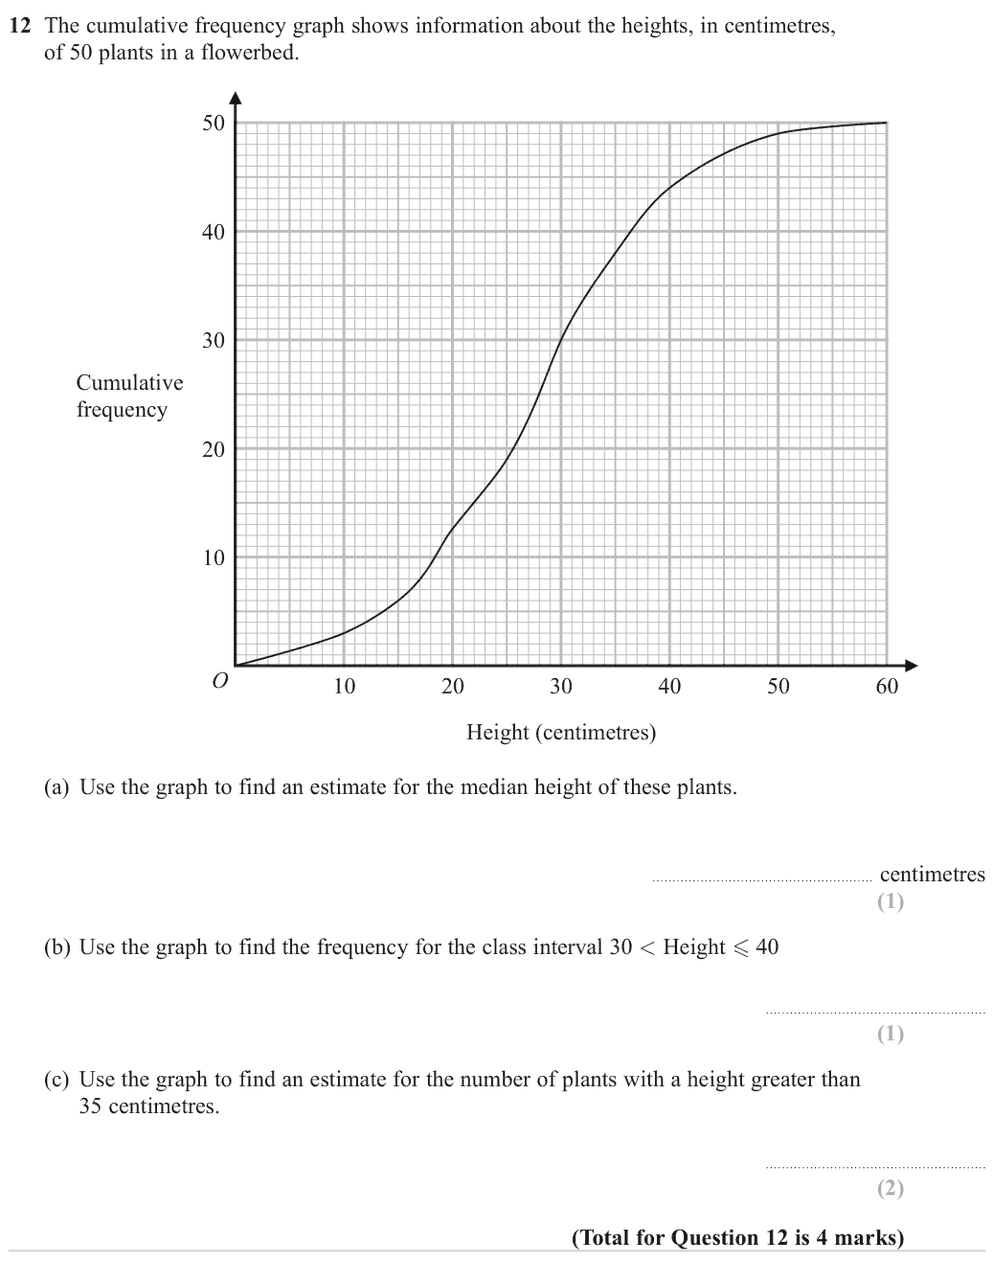
There are \(50\) plants, so read across from \(25\): the curve reaches \(25\) at about \(28.5\) cm.
(b) Frequency for 30 < height ≤ 40
Read the curve at both ends of the class: about \(44\) at \(40\) cm and \(30\) at \(30\) cm.
\[
44-30=14
\]
(c) Taller than 35 cm
At \(35\) cm the curve reads about \(37\), so about \(50-37=13\) plants.
Final answer
(a) about \(28.5\) cm (b) \(14\) (c) about \(13\)
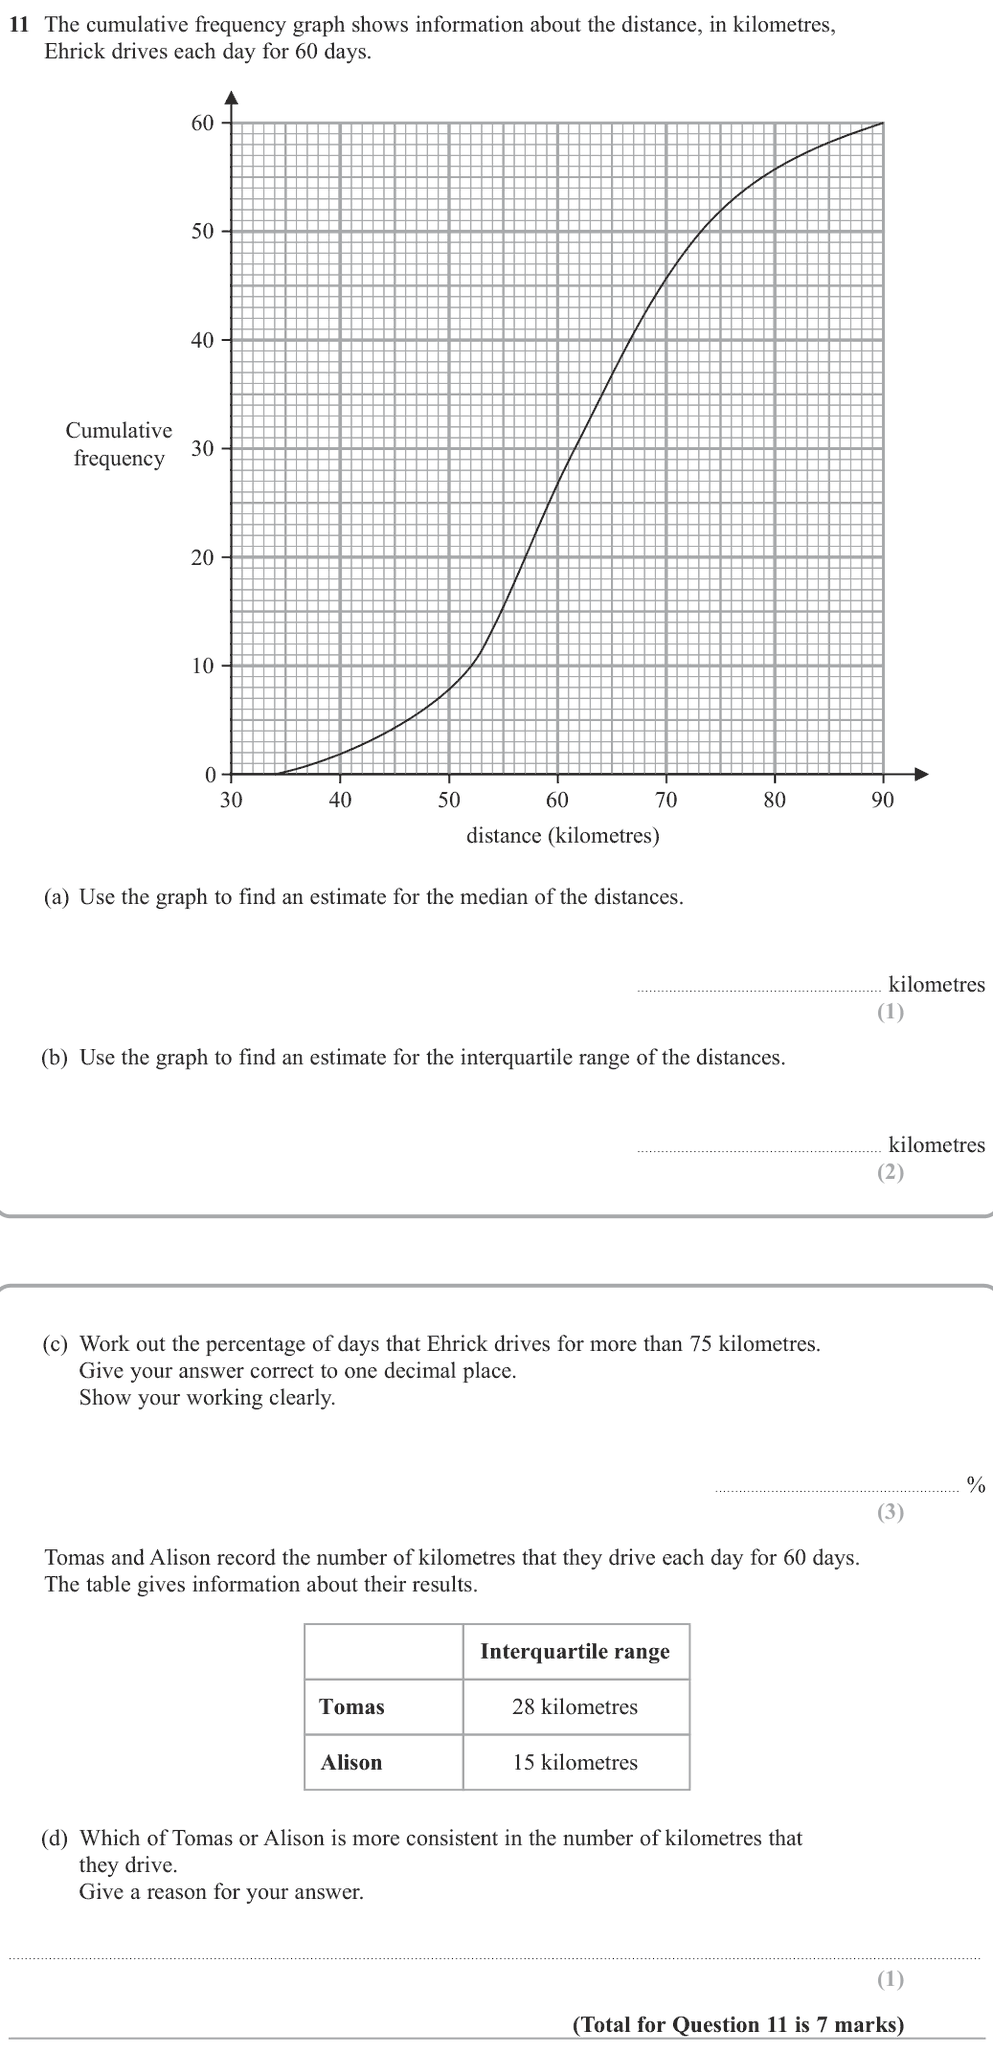
5. Nov 2025 4WM2H · Q14
Hard5 marksShow worked solution
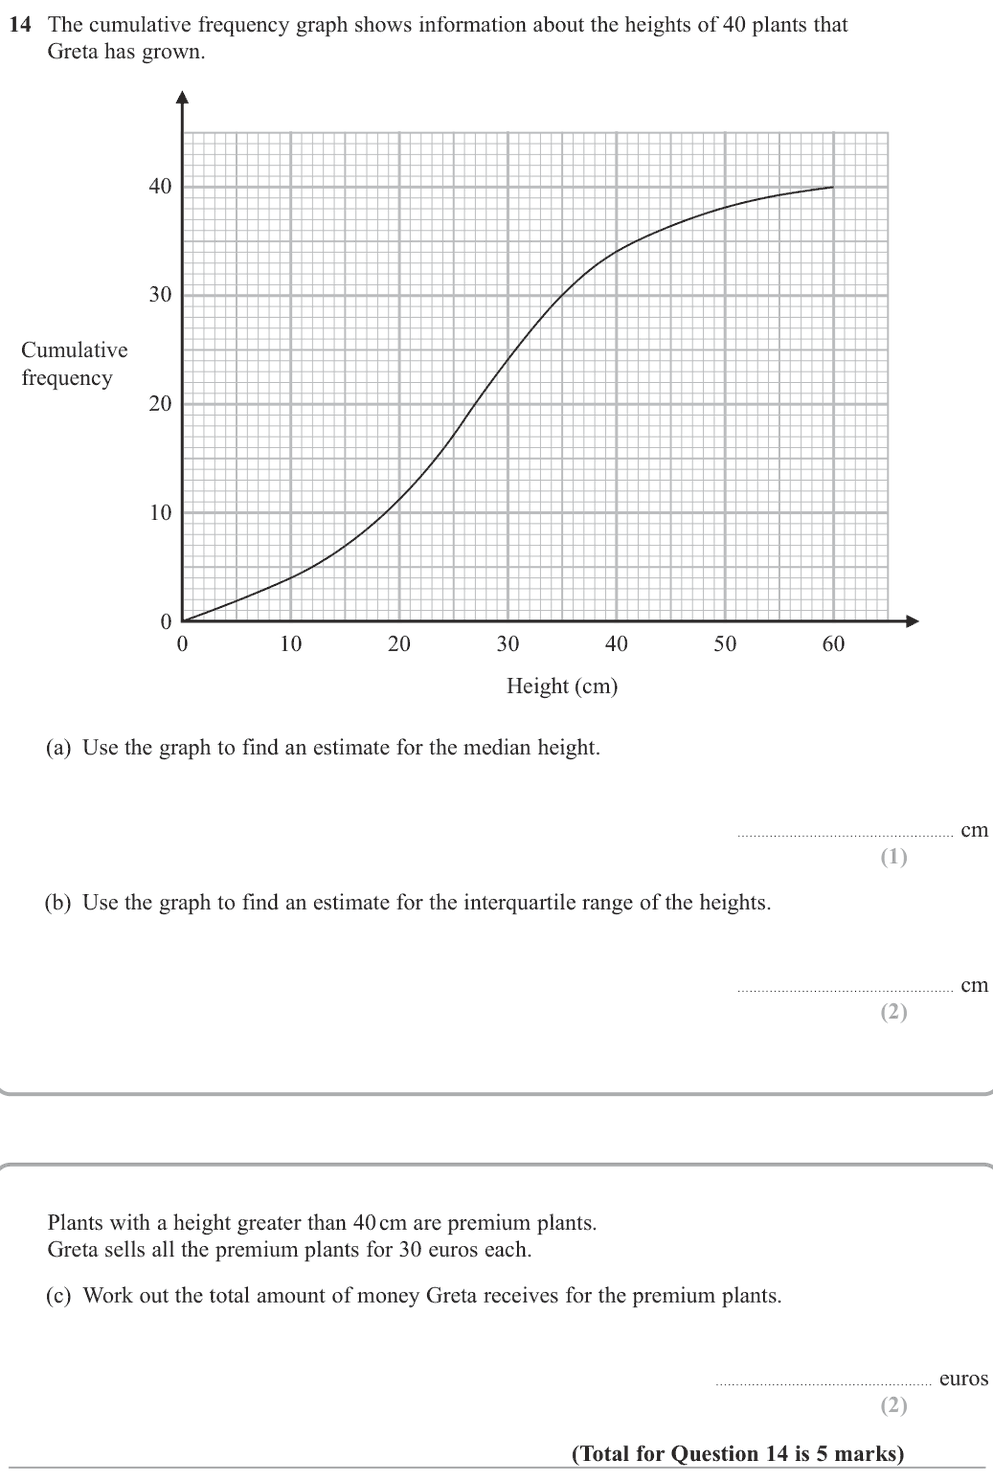
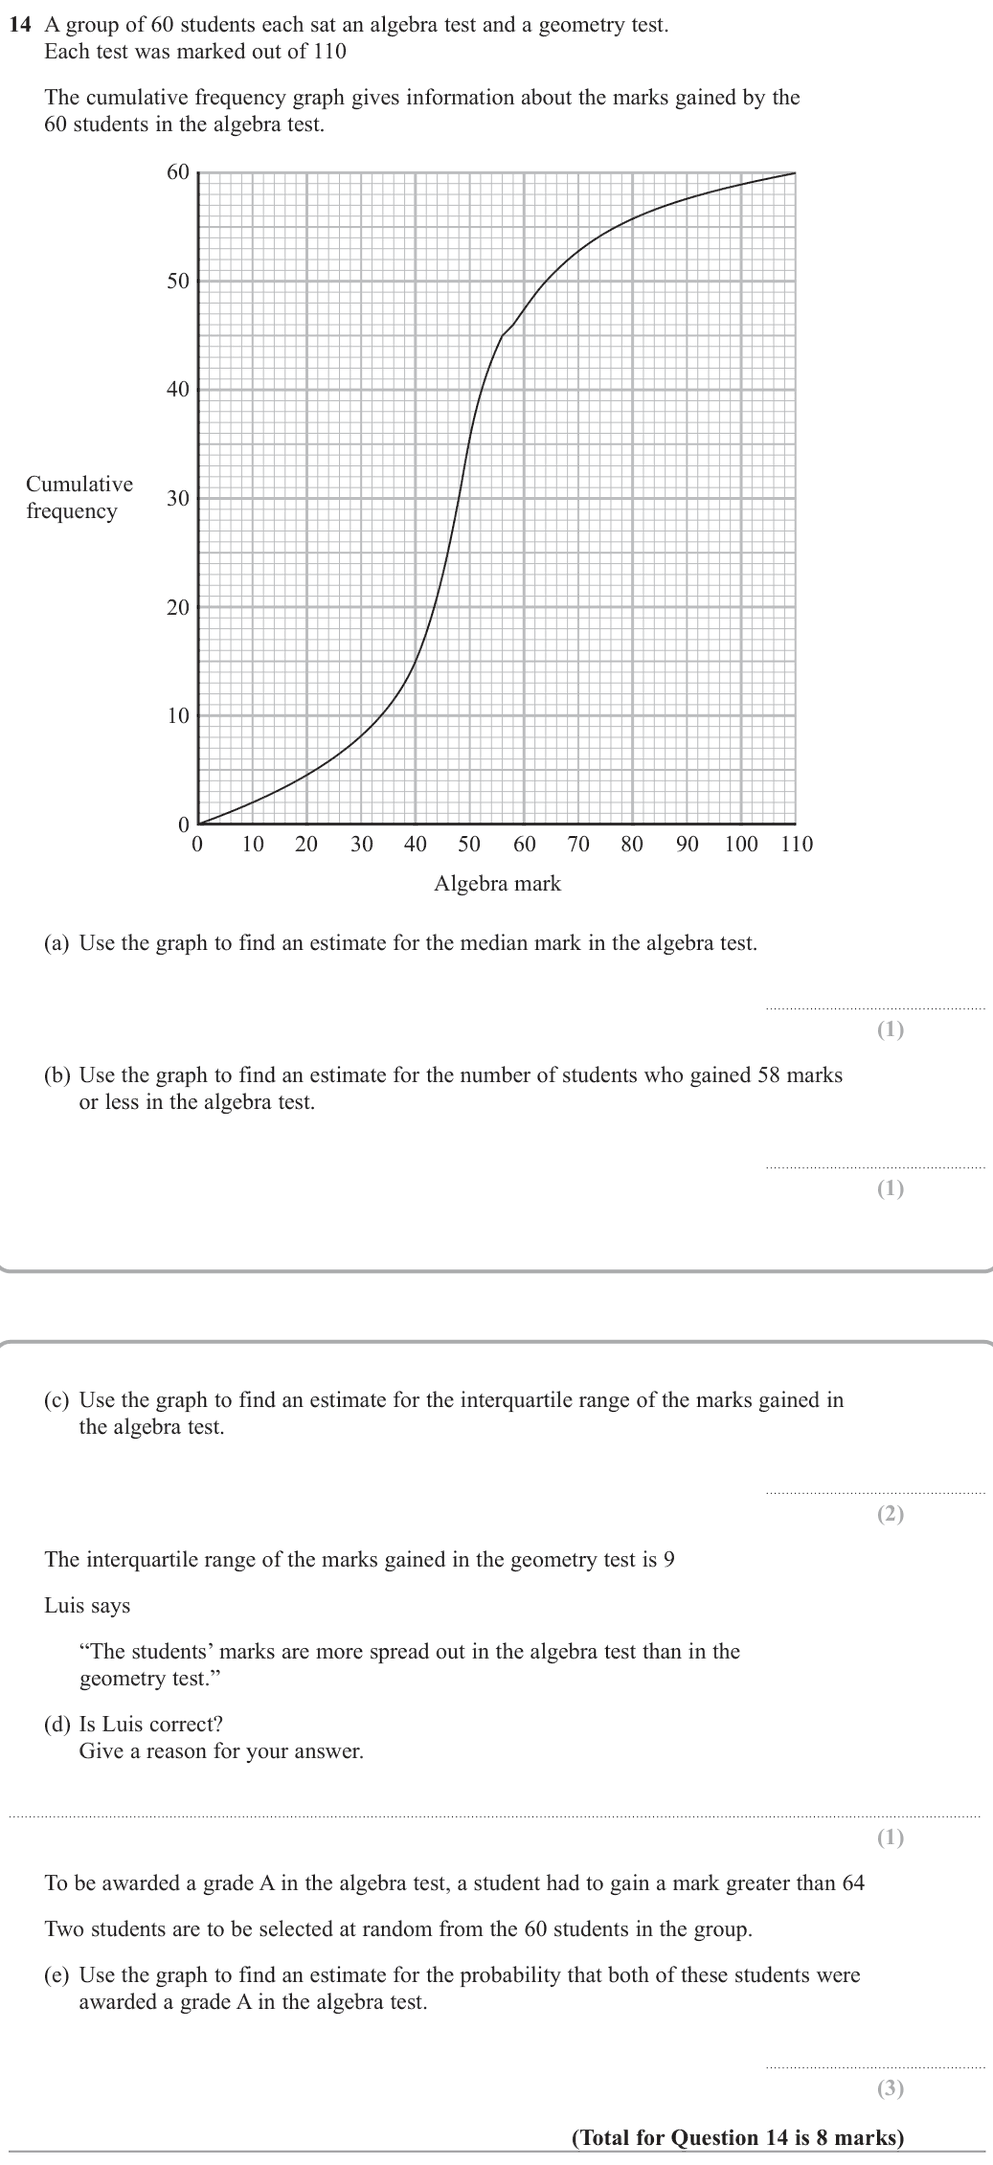
Part (a) Median Total plants
**Part (a) Median:** Total plants = 40. The median position is at cumulative frequency = 40/2 = 20. Reading across from CF = 20 to the curve and down to the x-axis gives:
Answer
\(a\) 30 cm
Part (b) Interquartile Range (IQR)
Lower Quartile (Q1) is at CF = 10. Reading the graph ⟹ Height = 20 cm.
Upper Quartile (Q3) is at CF = 30. Reading the graph ⟹ Height = 40 cm.
IQR = *Q*3 − *Q*1 = 40 − 20 = 20 cm
Answer
\(b\) 20 cm
**Part (c) Premium plants revenue:** Premium plants have height \> 40 cm. From the graph, cumulative frequency at 40 cm is 30. This means 30 plants are ≤ 40 cm. Number of premium plants = 40 − 30 = 10 plants Total Money = 10 plants × 30 euros = 300 euros
Final answer
\(c\) 300 euros
6. Nov 2025 P2H · Q14
Hard5 marksShow worked solution
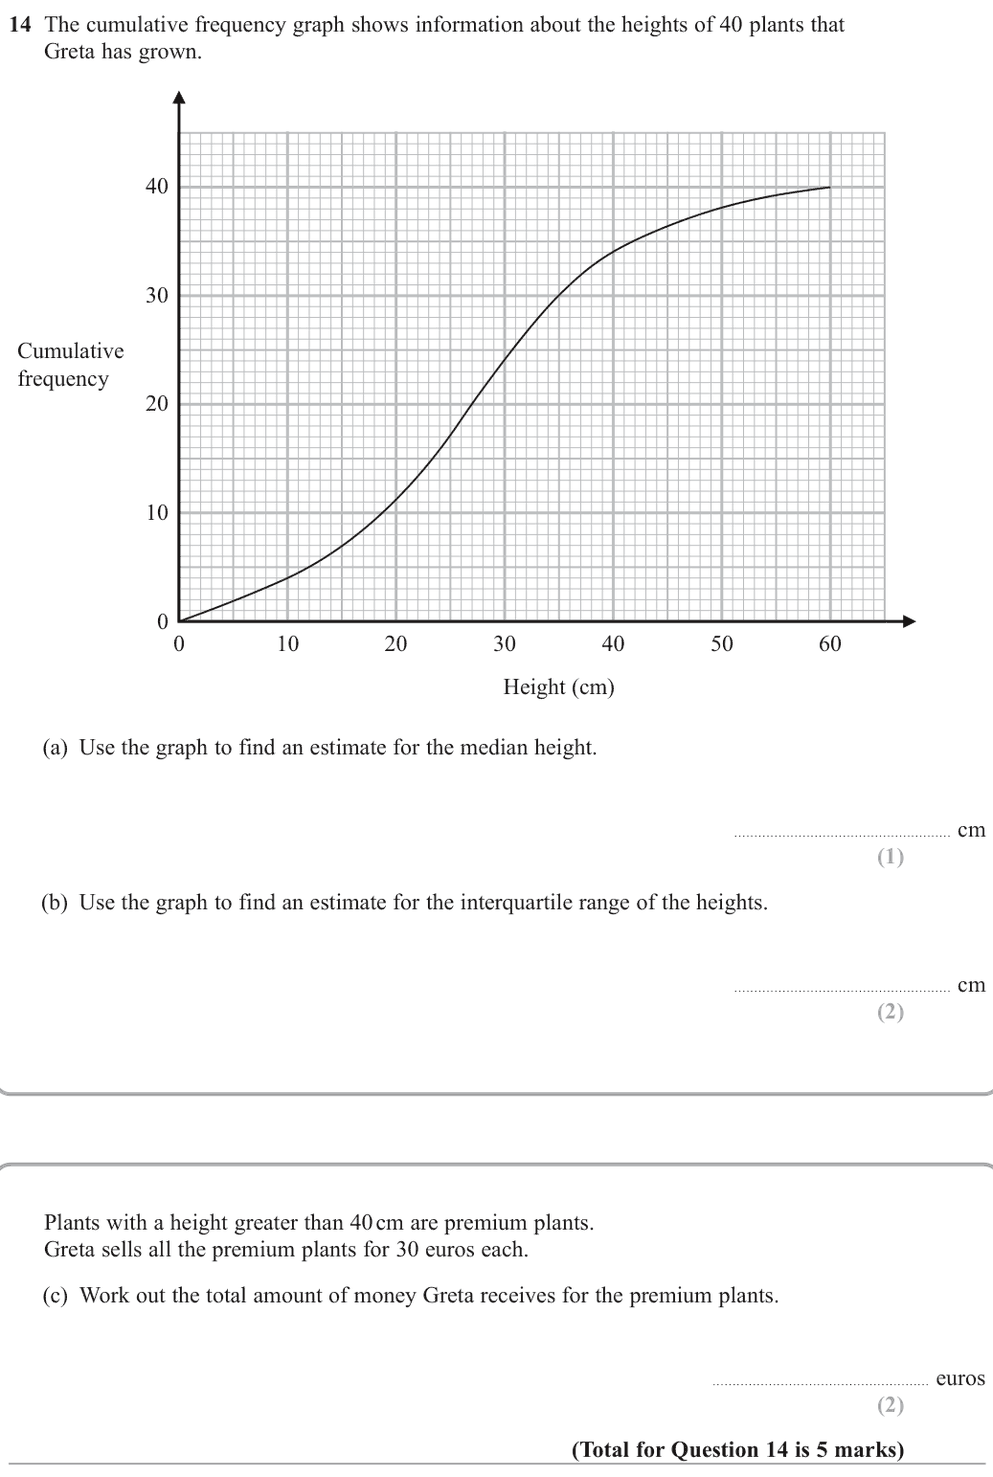
(a) Median
Read across from \(\frac{40}{2}=20\): about \(27\) cm.
(b) Interquartile range
Lower quartile at \(10\): about \(19\) cm. Upper quartile at \(30\): about \(35\) cm.
\[
\text{IQR}\approx35-19=16\text{ cm}
\]
(c) Premium plants
At \(40\) cm the curve reads about \(34\), so \(40-34=6\) plants are taller than \(40\) cm.
\[
6\times30=180\text{ euros}
\]
Final answer
(a) about \(27\) cm (b) about \(16\) cm (c) \(180\) euros
7. Nov 2021 P1H · Q11
Hard5 marksShow worked solution
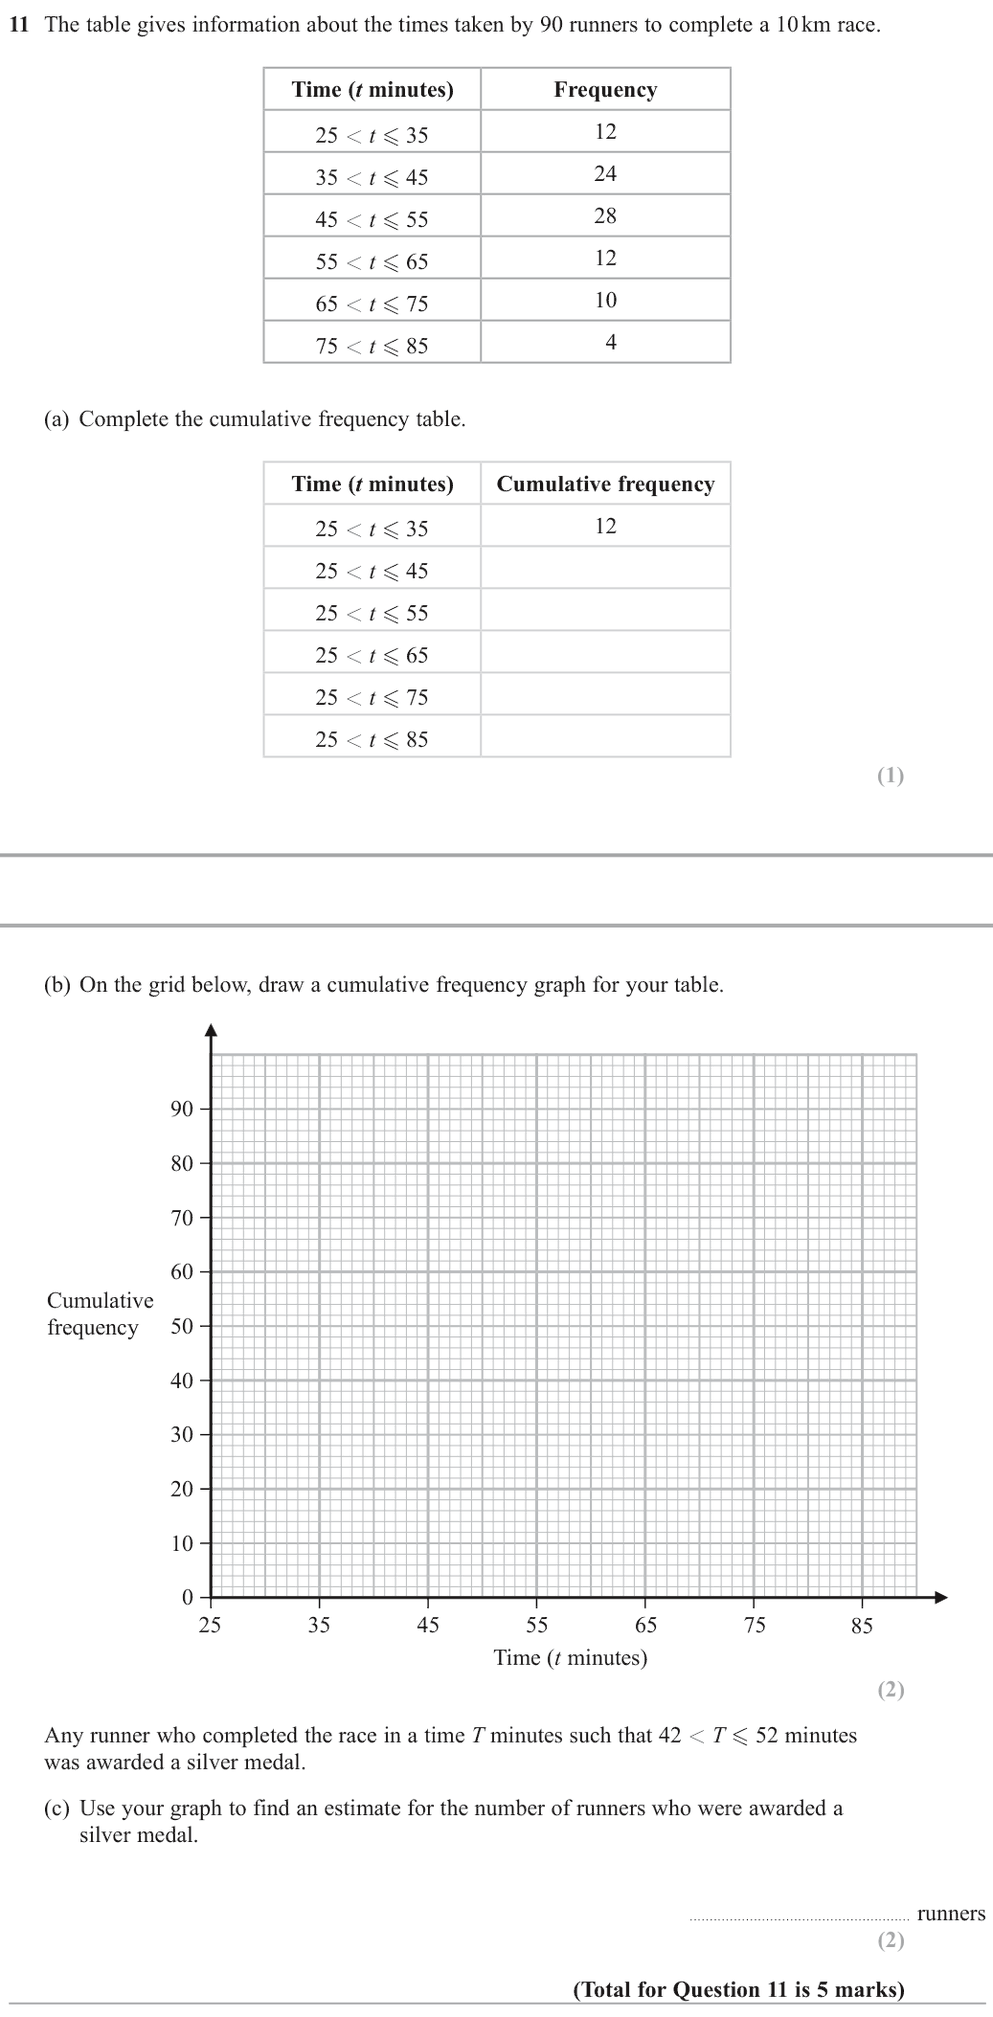
(a) Running totals
\[
12,\ 36,\ 64,\ 76,\ 86,\ 90
\]
(b) Plot at the upper class boundaries
Plot \((35,12),(45,36),(55,64),(65,76),(75,86),(85,90)\), start at \((25,0)\), and join with a smooth curve.
(c) Read the curve at 52 and 42 minutes
At \(52\) minutes: about \(56\). At \(42\) minutes: about \(29\).
(c) Silver medals
\[
56-29\approx27\text{ runners}
\]
Final answer
(a) \(12, 36, 64, 76, 86, 90\) (c) about \(27\)
8. Jan 2021 P1H · Q11
Hard5 marksShow worked solution
Use cumulative frequency
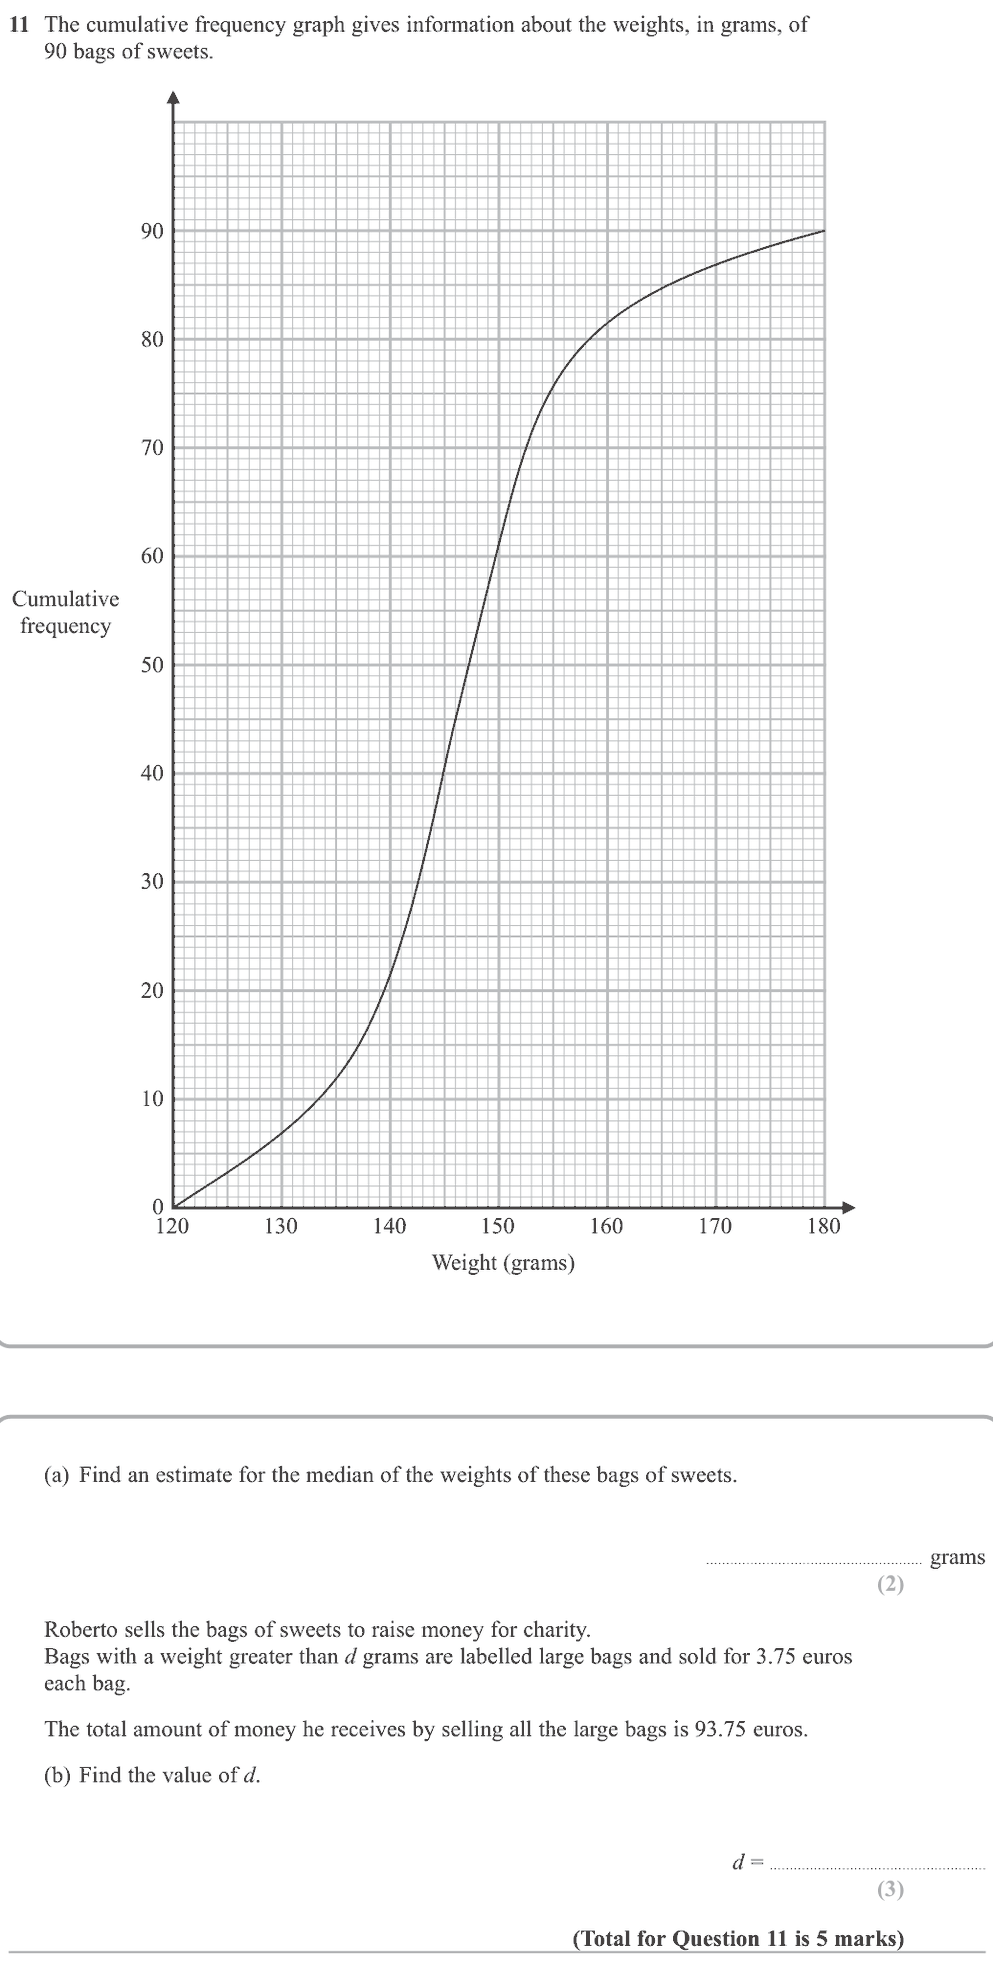
There are \(90\) bags, so the median is at cumulative frequency \(45\).
Use cumulative frequency
From the graph,
\[
\text{median}\approx 146\text{ g}
\]
Large bags sold
Large bags sold:
\[
\frac{93.75}{3.75}=25
\]
Use cumulative frequency
So \(25\) bags have weight greater than \(d\).
That means
\[
90-25=65
\]
Use cumulative frequency
bags have weight \(d\) grams or less.
Use cumulative frequency
From the graph, cumulative frequency \(65\) gives
\[
d\approx 150
\]
Final answer
median about \(146\text{ g}\), and \(d\approx 150\).
9. Jan 2020 P1H · Q12
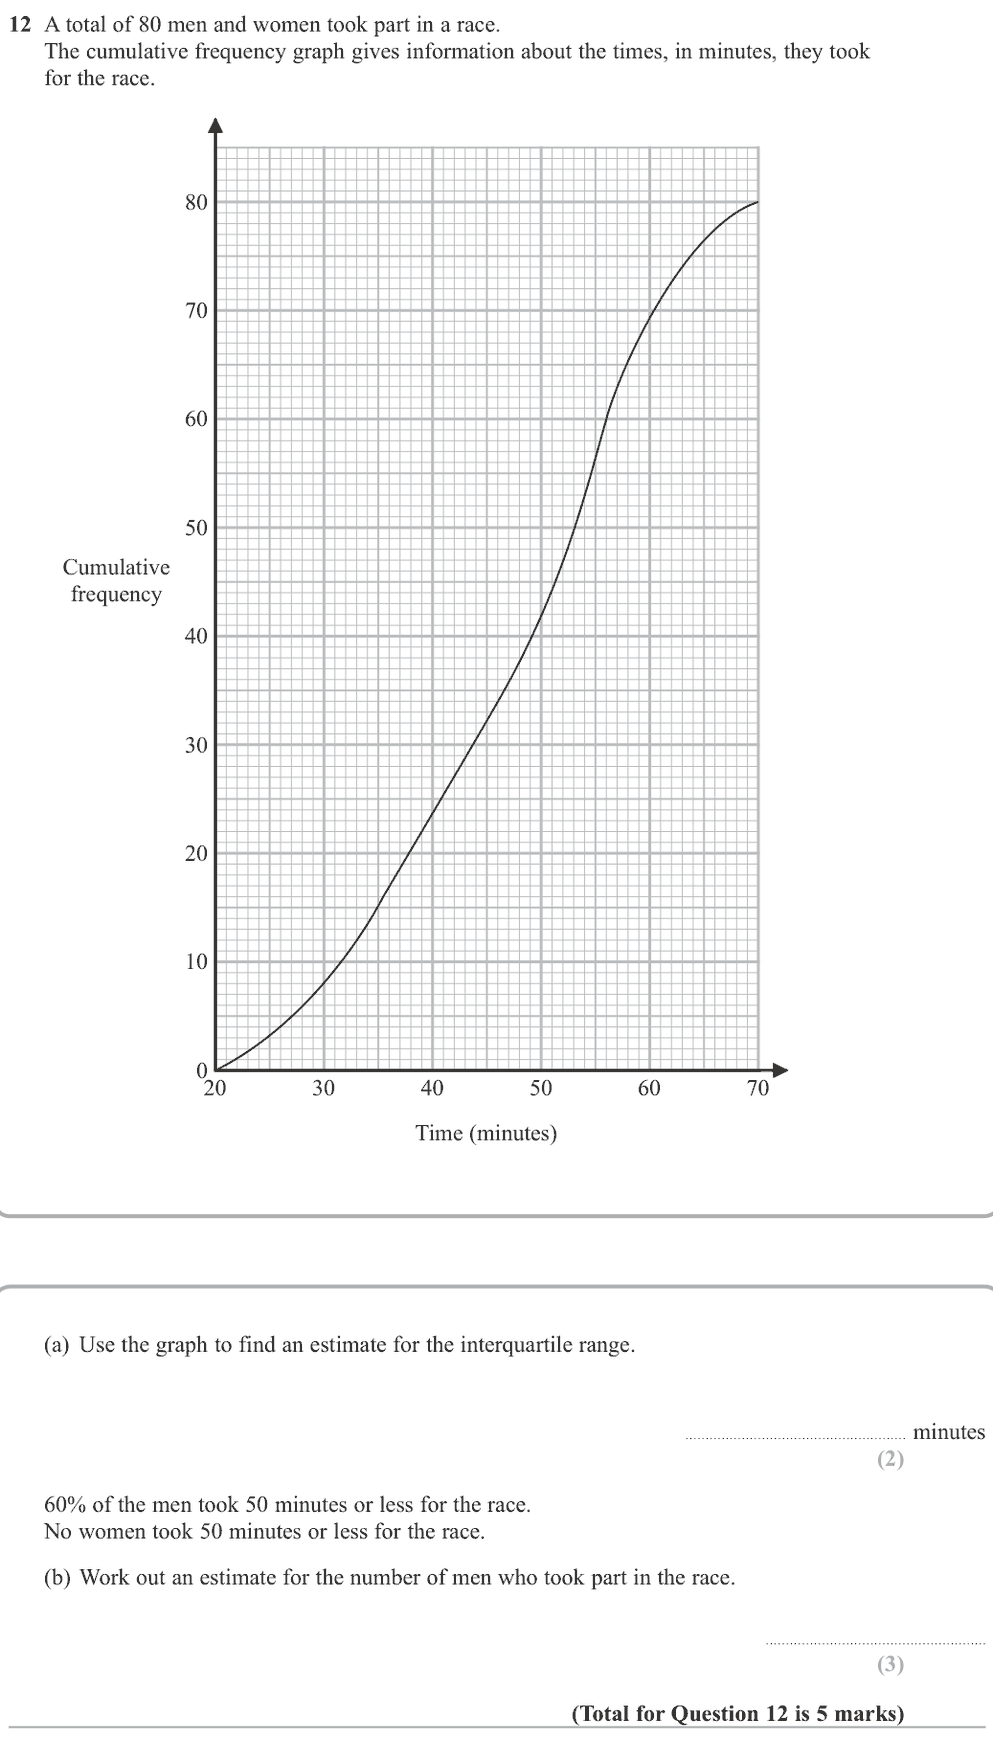
Hard5 marksShow worked solution
There are people
There are \(80\) people.
Use cumulative frequency
For the interquartile range:
\[
Q_1 \text{ is at cumulative frequency }20
\]
\[
Q_3 \text{ is at cumulative frequency }60
\]
Use cumulative frequency
From the graph,
\[
Q_1\approx 38,\qquad Q_3\approx 56
\]
\[
\text{IQR}\approx 56-38=18
\]
Use cumulative frequency
At \(50\) minutes, the cumulative frequency is about \(42\).
Use cumulative frequency
No women took \(50\) minutes or less, so these \(42\) people are men.
\[
0.6 \times \text{number of men}=42
\]
\[
\text{number of men}=\frac{42}{0.6}=70
\]
Final answer
IQR about \(18\) minutes, and about \(70\) men.
10. Jan 2020 P1HR · Q12
Hard5 marksShow worked solution
There are people
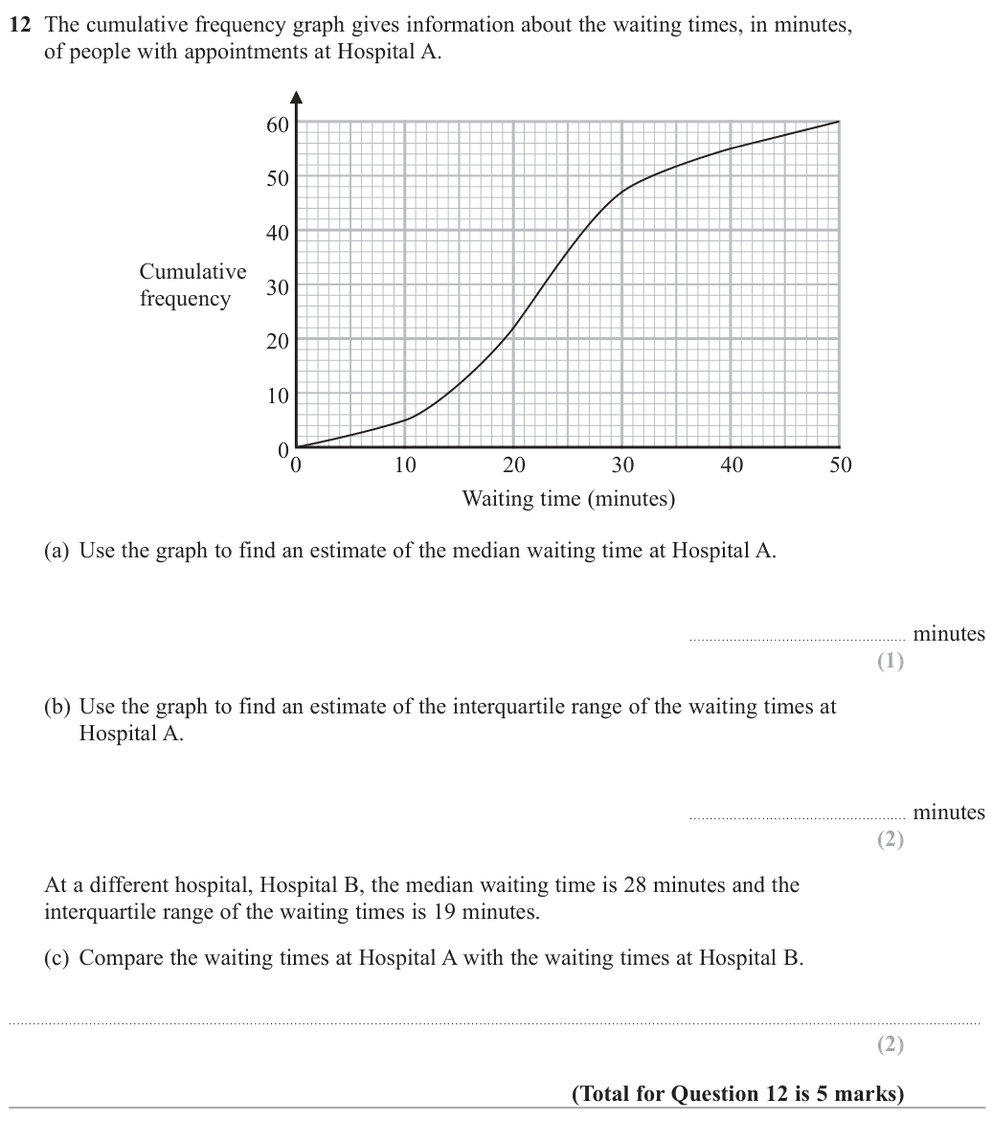
There are \(60\) people.
The median is at cumulative
The median is at cumulative frequency \(30\).
Use cumulative frequency
From the graph,
\[
\text{median}\approx 22.5\text{ minutes}
\]
Use cumulative frequency
For the interquartile range:
\[
Q_1 \text{ is at }15,\qquad Q_3 \text{ is at }45
\]
Use cumulative frequency
From the graph,
\[
Q_1\approx 16.5,\qquad Q_3\approx 28.5
\]
\[
\text{IQR}\approx 28.5-16.5=12
\]
Hospital B has median minutes
Hospital B has median \(28\) minutes and IQR \(19\) minutes.
Use cumulative frequency
So Hospital A has a shorter median waiting time and a smaller spread.
Final answer
median about \(22.5\) minutes, IQR about \(12\) minutes. Hospital A is quicker and more consistent.
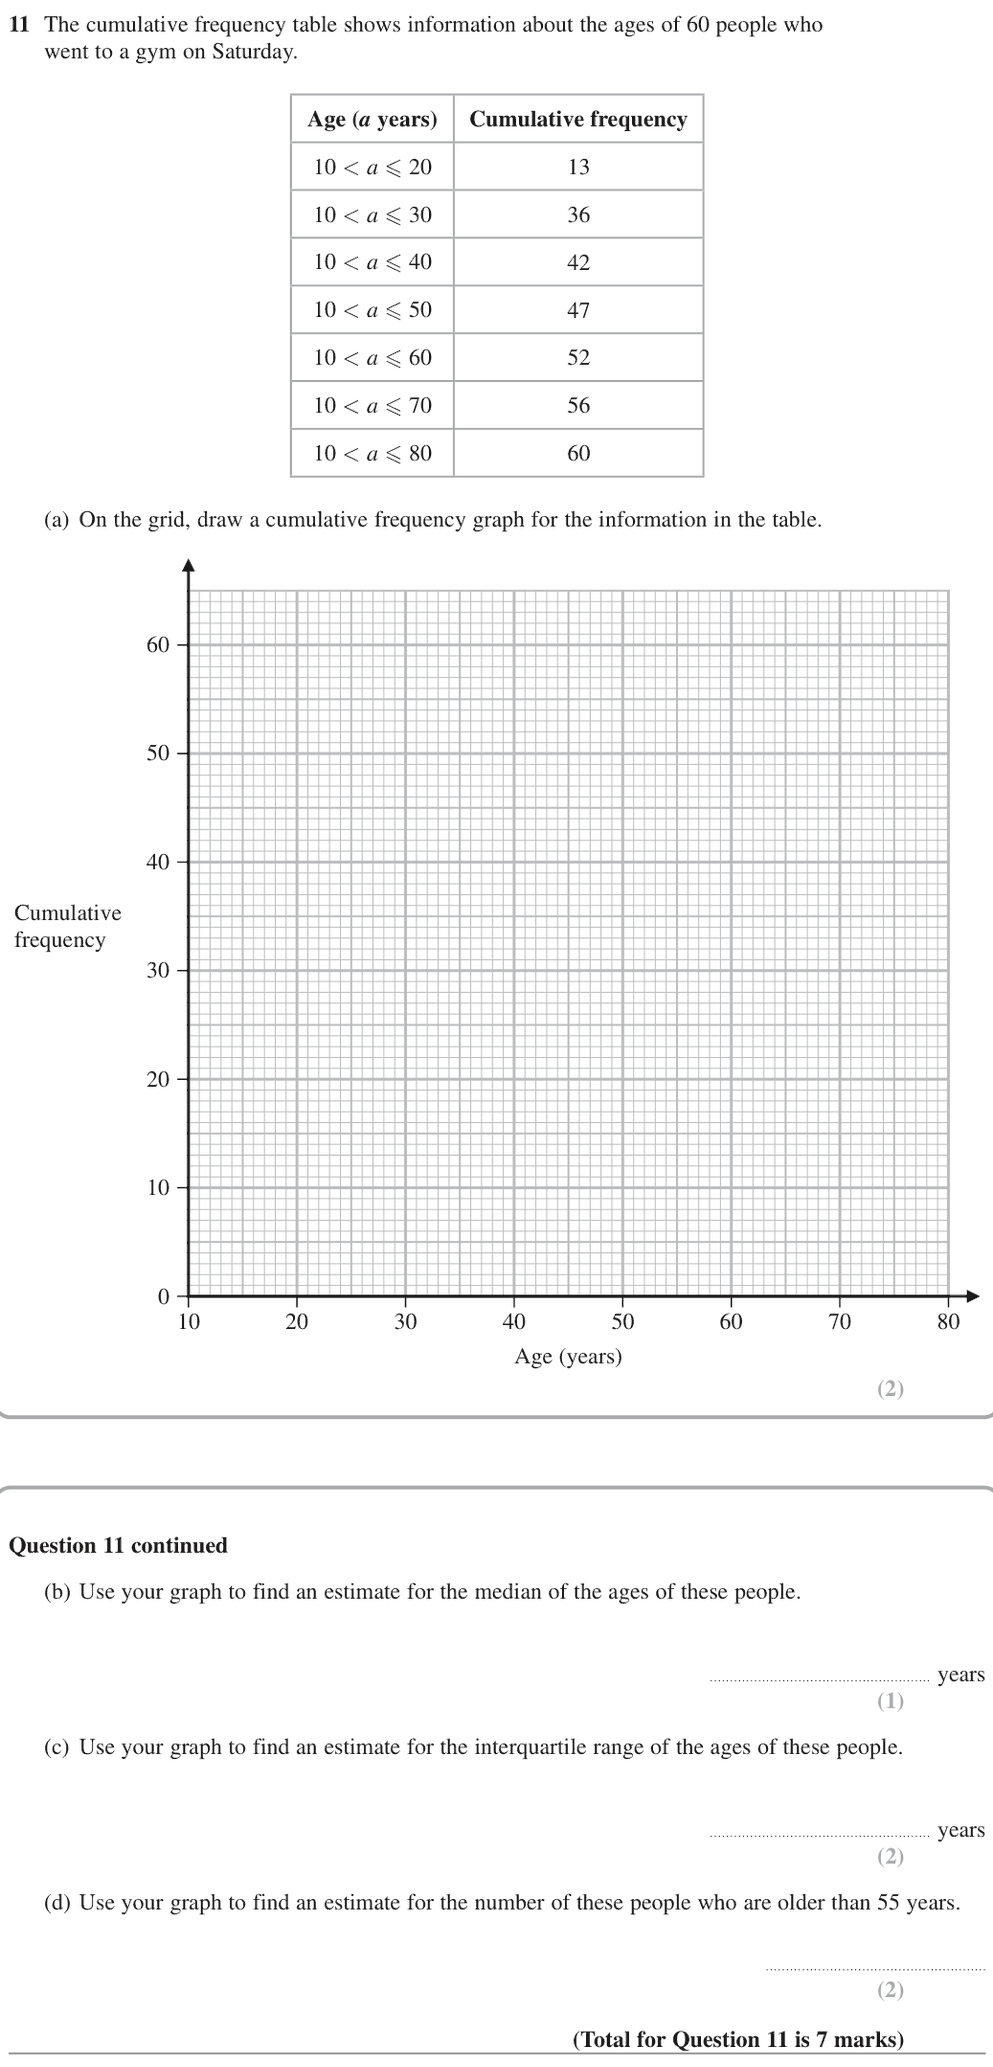
11. May-Nov 2020 P1HR · Q11
Hard5 marksShow worked solution
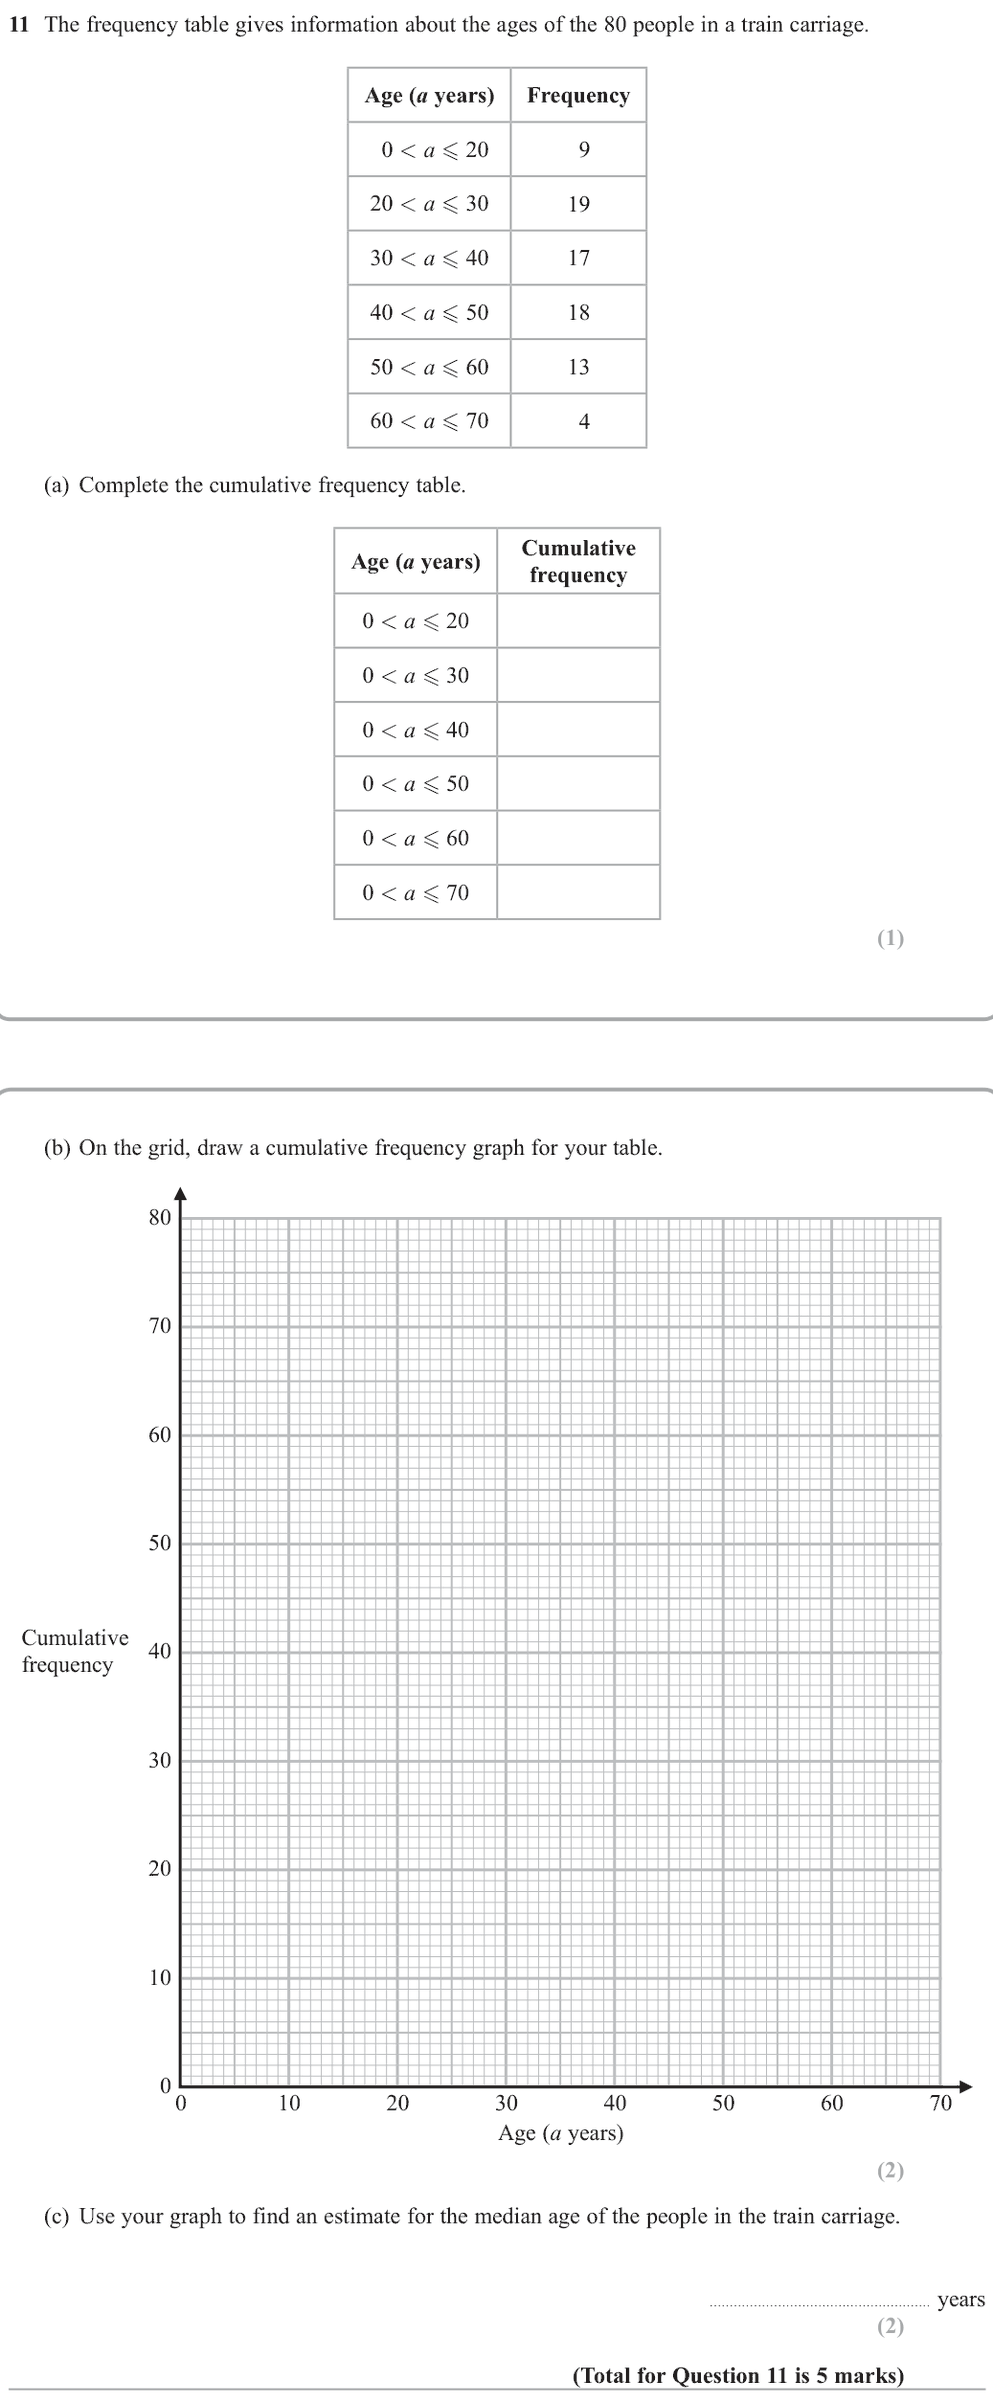
(a) Running totals
\[
9,\ 28,\ 45,\ 63,\ 76,\ 80
\]
(b) Plot at the upper class boundaries
Plot \((20,9),(30,28),(40,45),(50,63),(60,76),(70,80)\), start at \((0,0)\), and join with a smooth curve.
(c) Median
Read across from \(\frac{80}{2}=40\): about \(37\) years.
Final answer
(a) \(9, 28, 45, 63, 76, 80\) (c) about \(37\) years
12. Jun 2026 4WM2HR · Q13
Hard6 marksShow worked solution
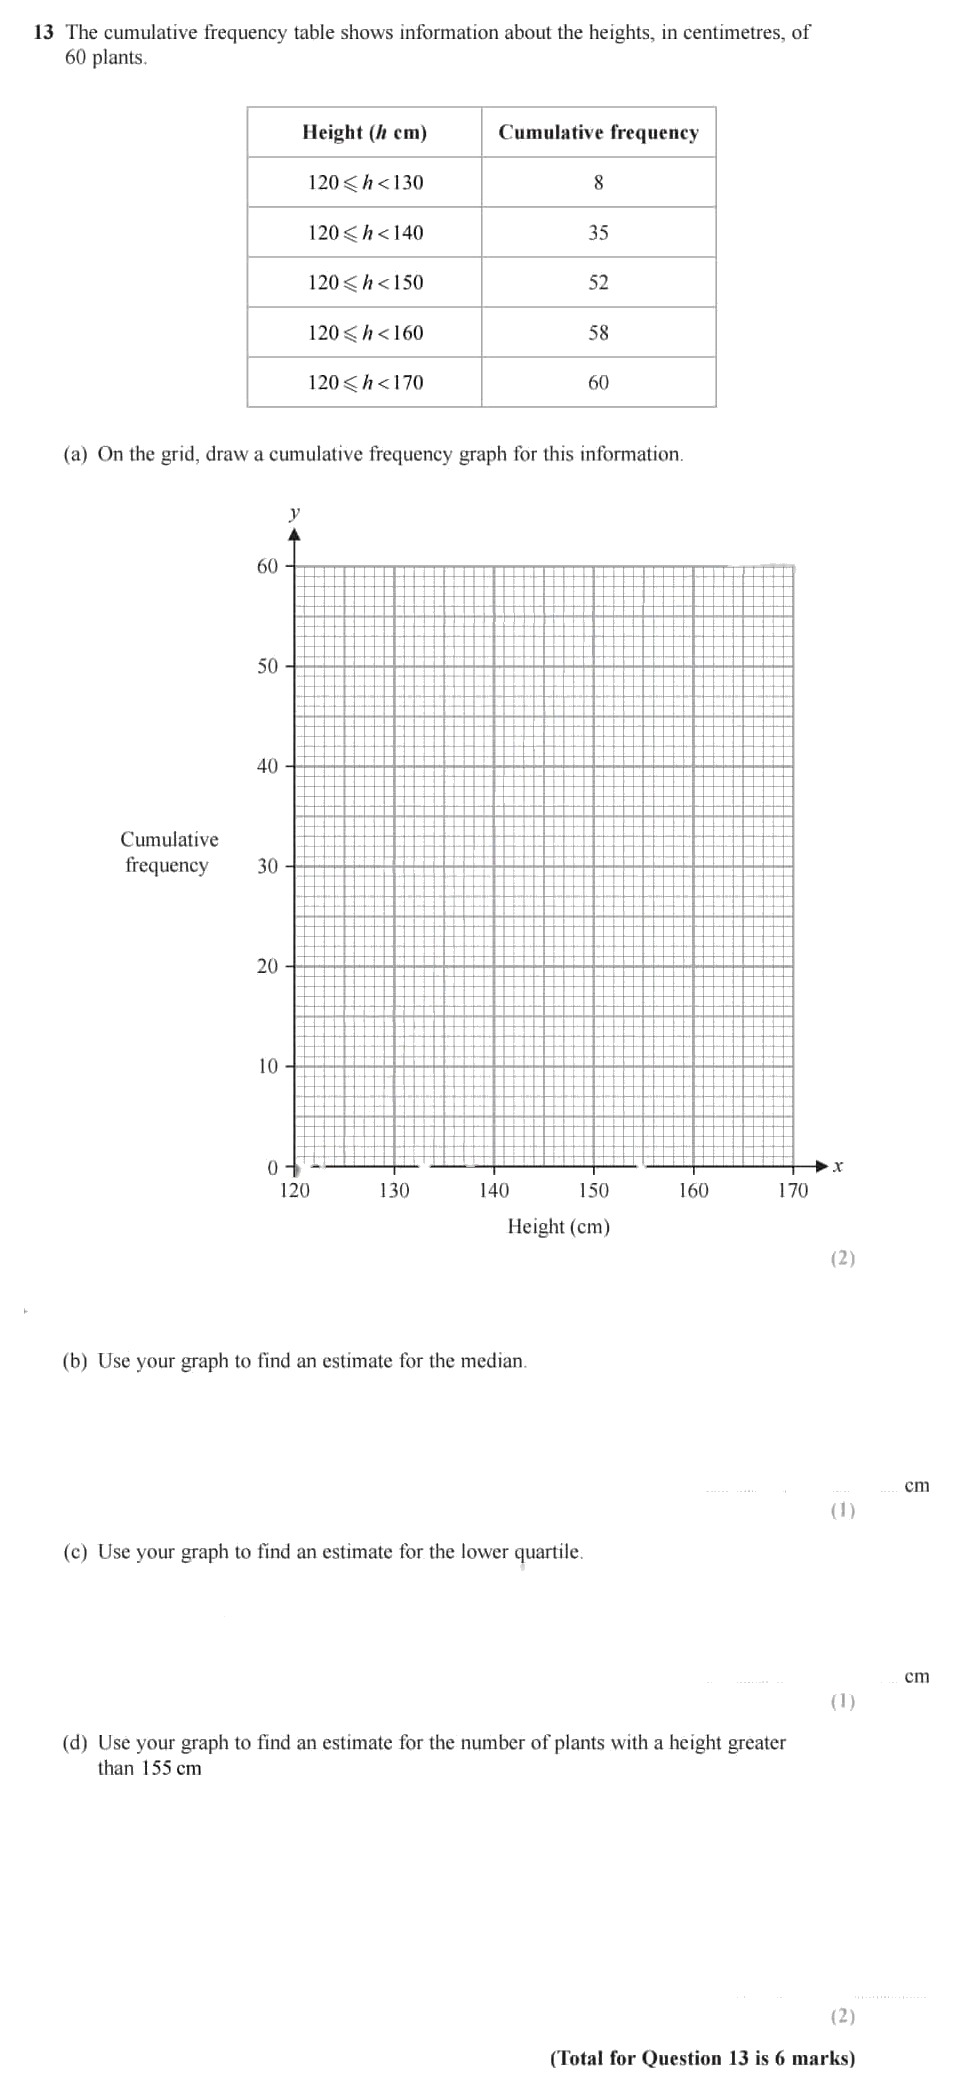
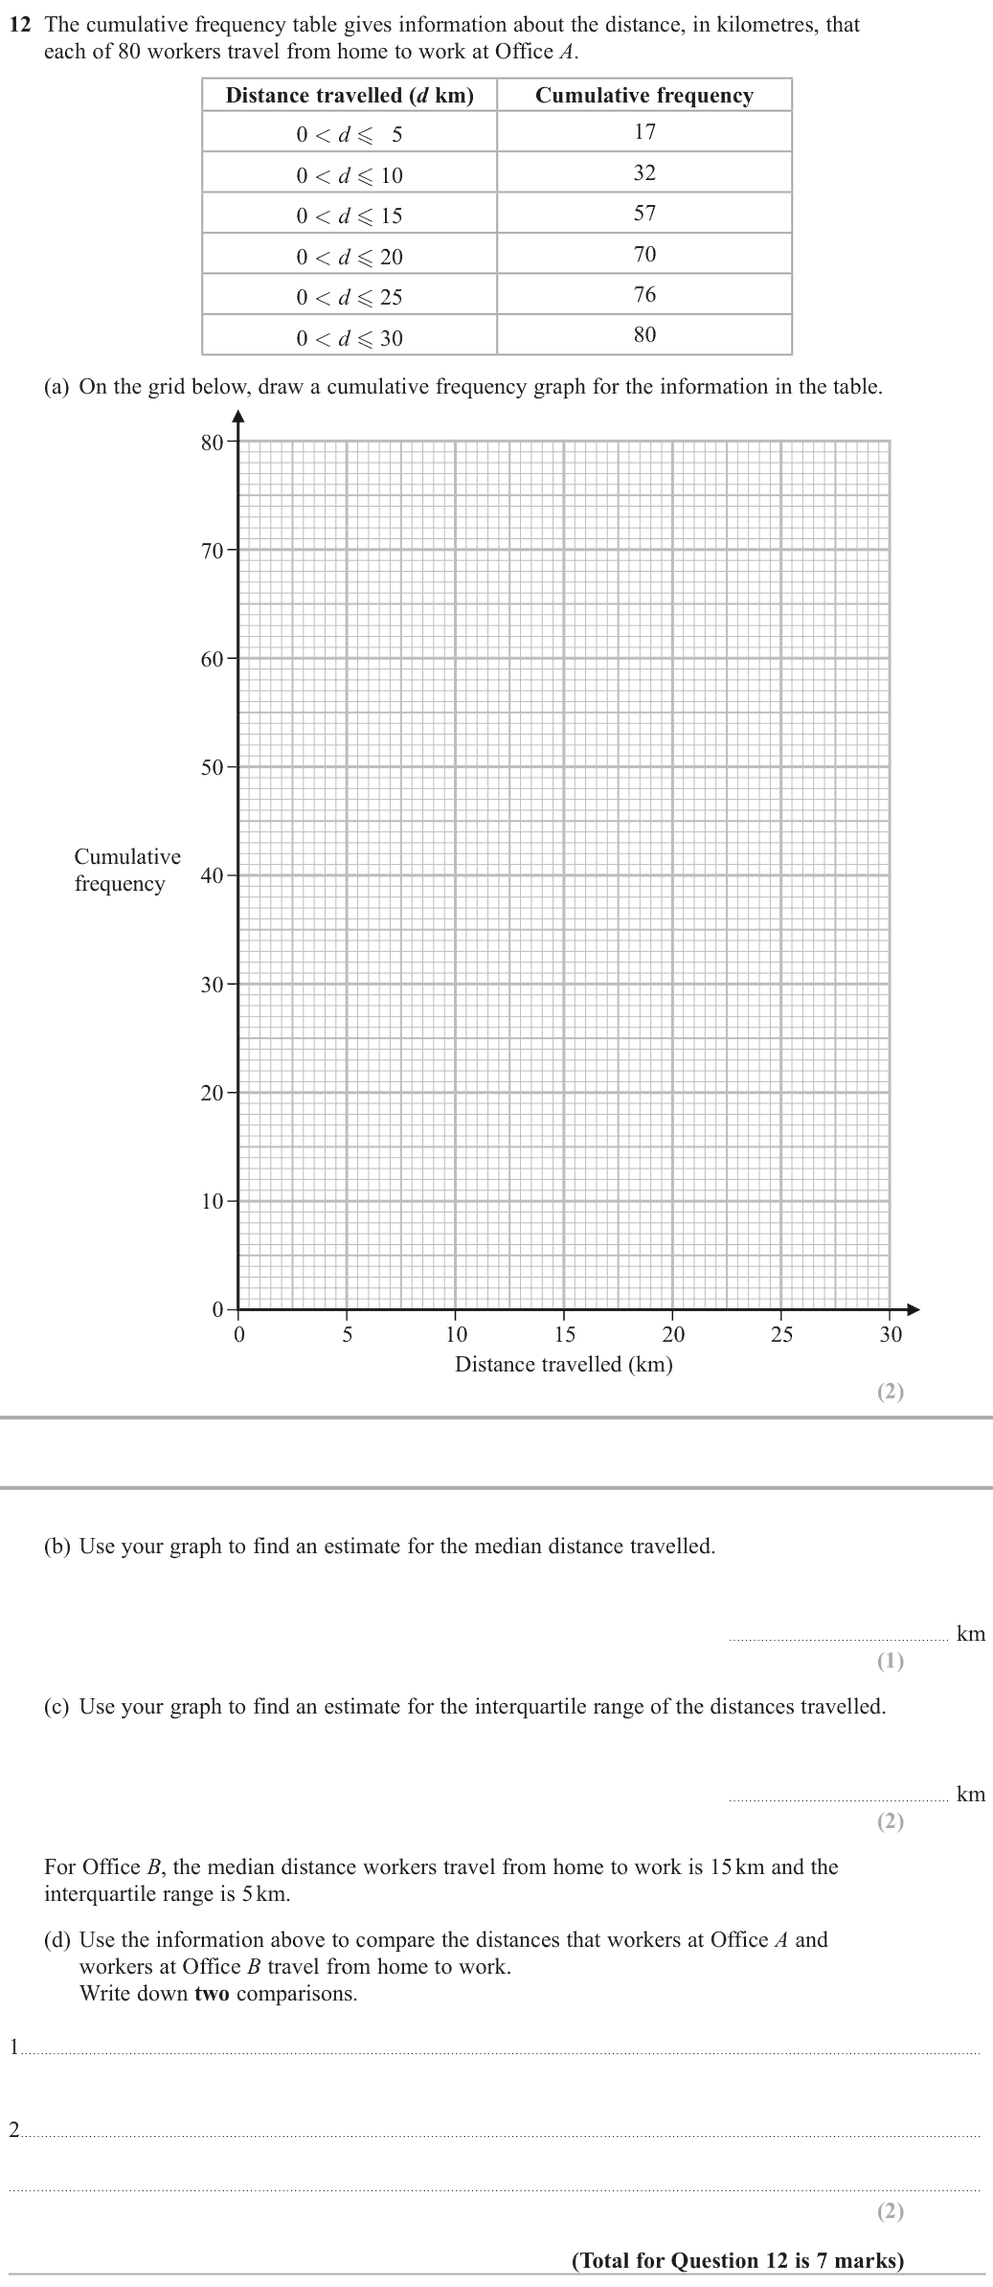
(a) Plot at the upper class boundaries
Plot \((130,8),(140,35),(150,52),(160,58),(170,60)\), start at \((120,0)\) and join with a smooth curve.
(b) Median
\(\tfrac12\times60=30\): read across from 30 → about \(138\) cm.
(c) Lower quartile
\(\tfrac14\times60=15\): read across from 15 → about \(133\) cm.
(d) Taller than 155 cm
Up from 155 cm the curve reads about \(55\), so \(60-55=5\) plants.
Final answer
(b) \(138\) cm (c) \(133\) cm (d) about \(5\) plants
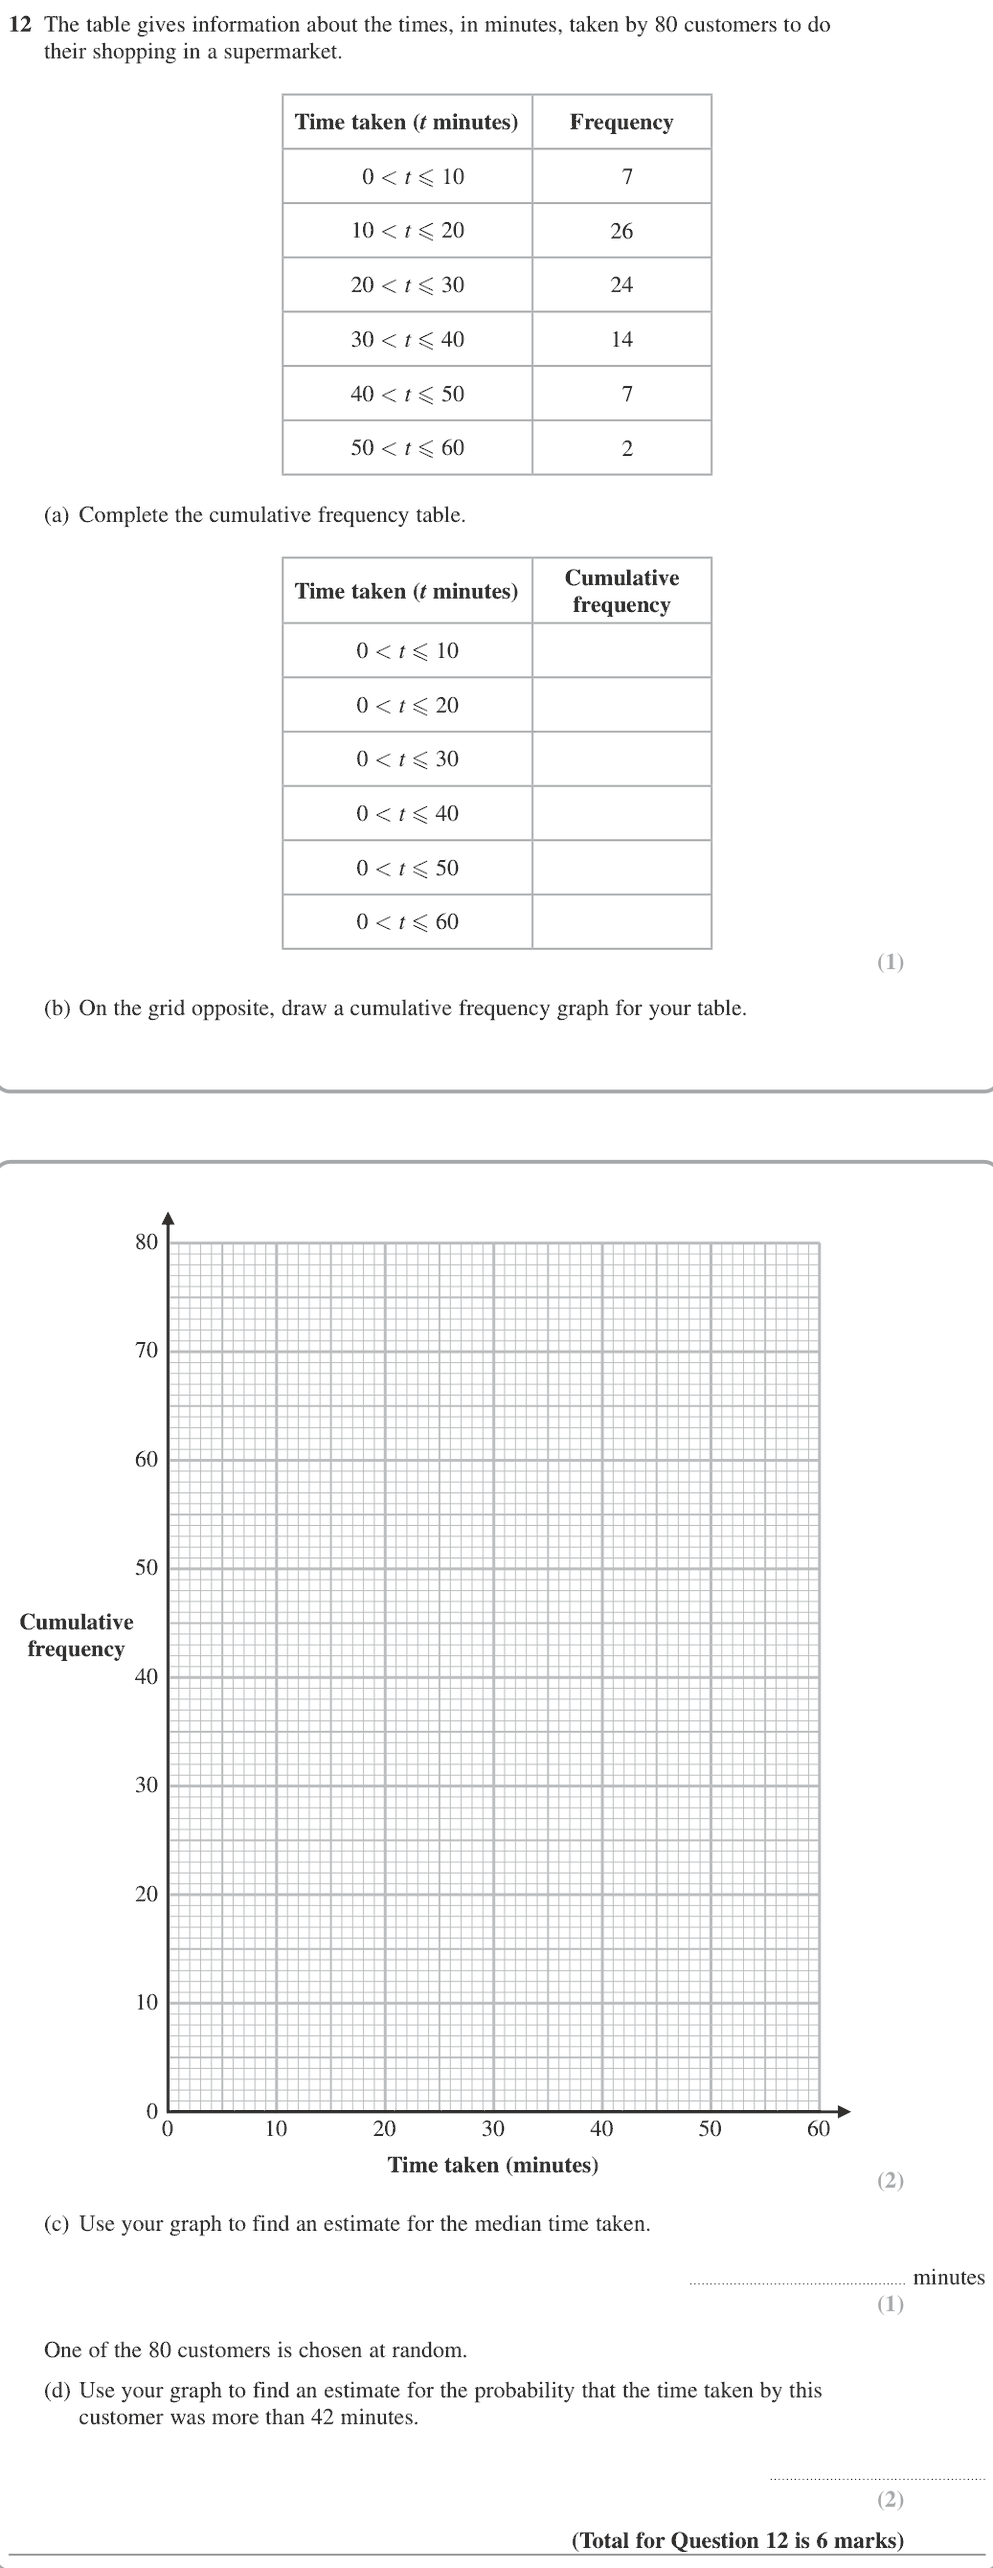
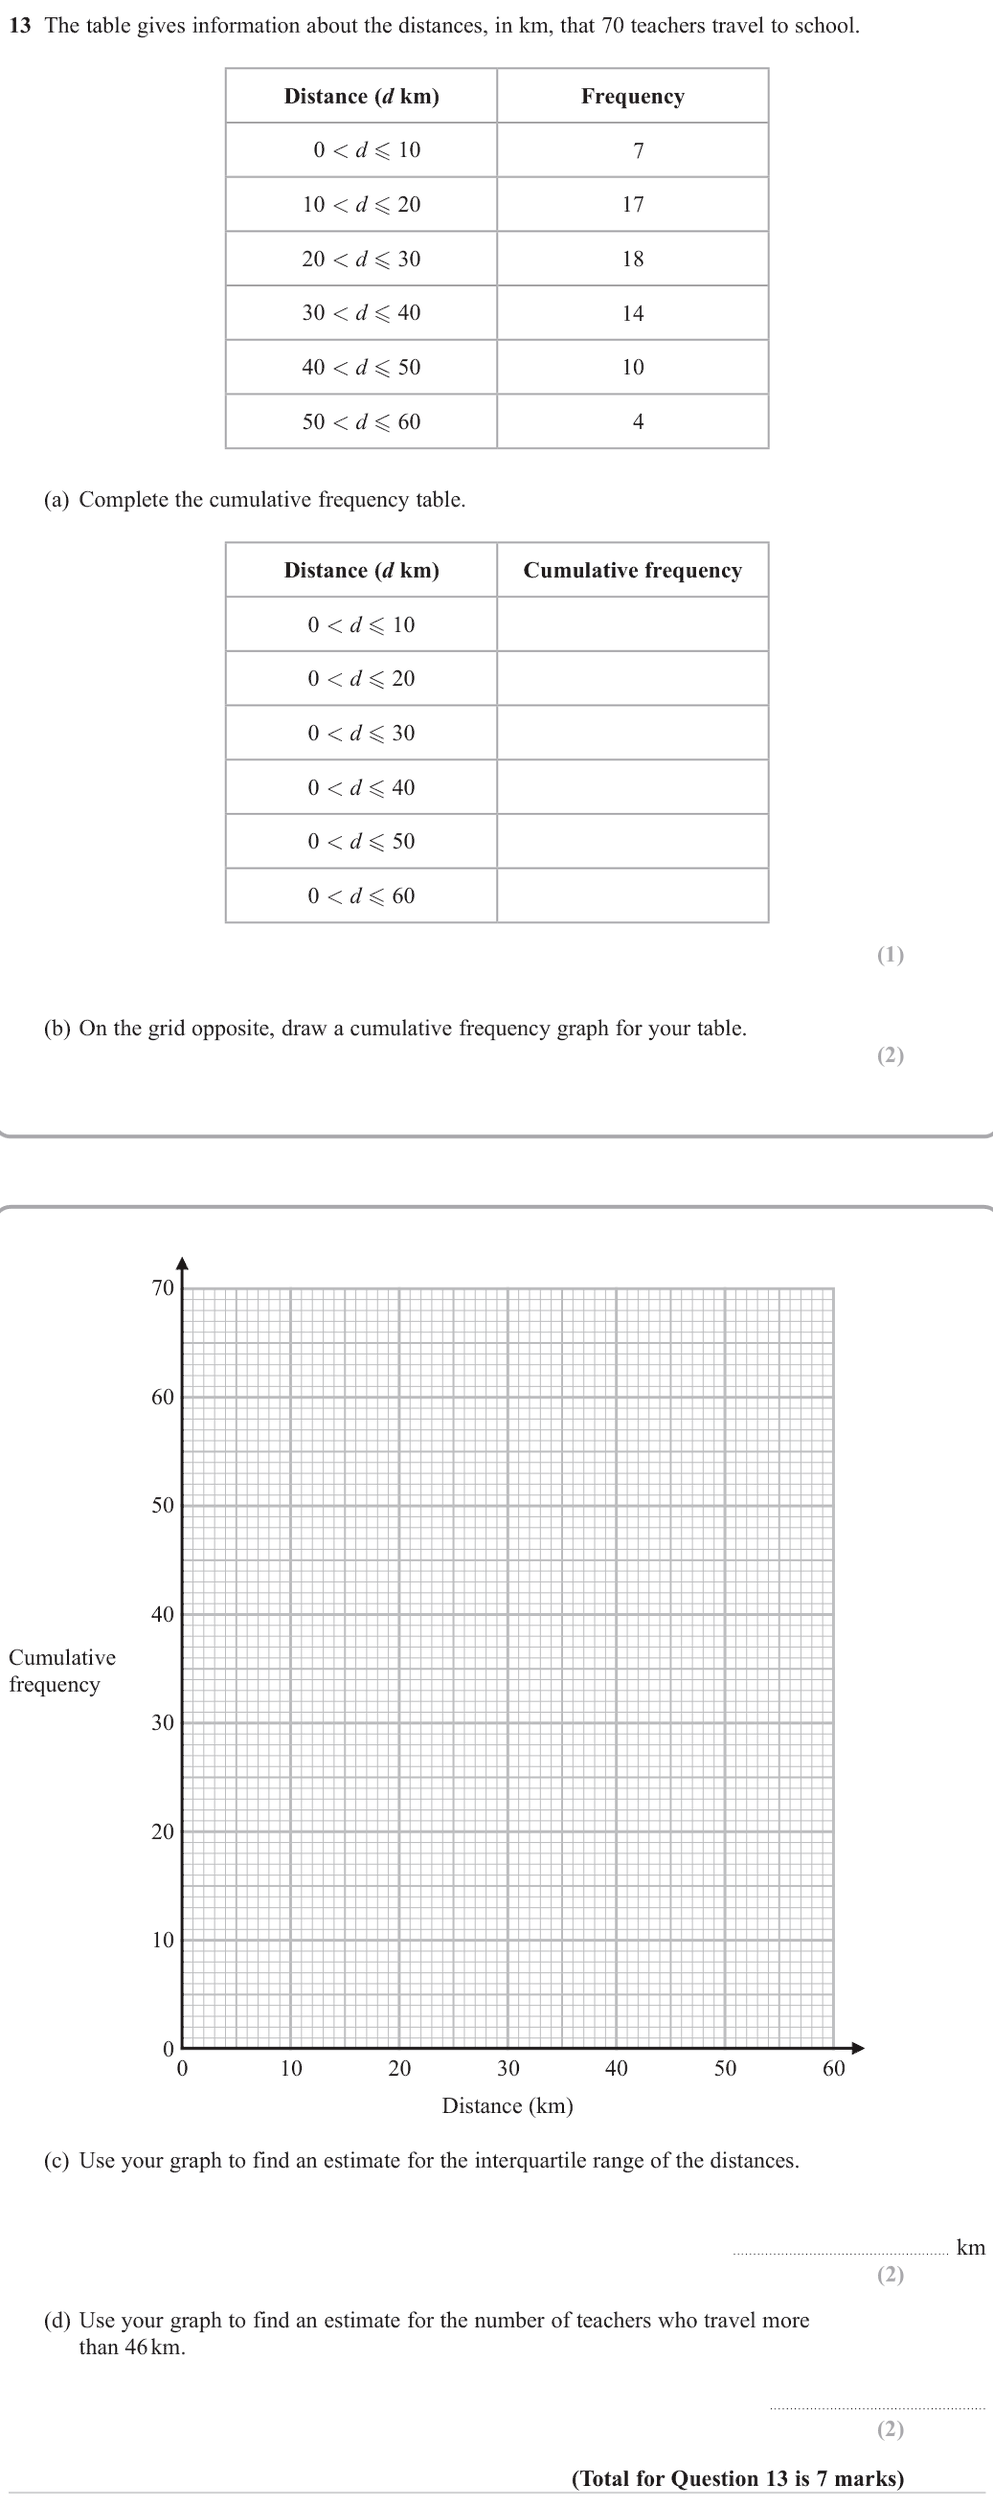
13. Jun 2025 P1HR · Q12
Hard6 marksShow worked solution
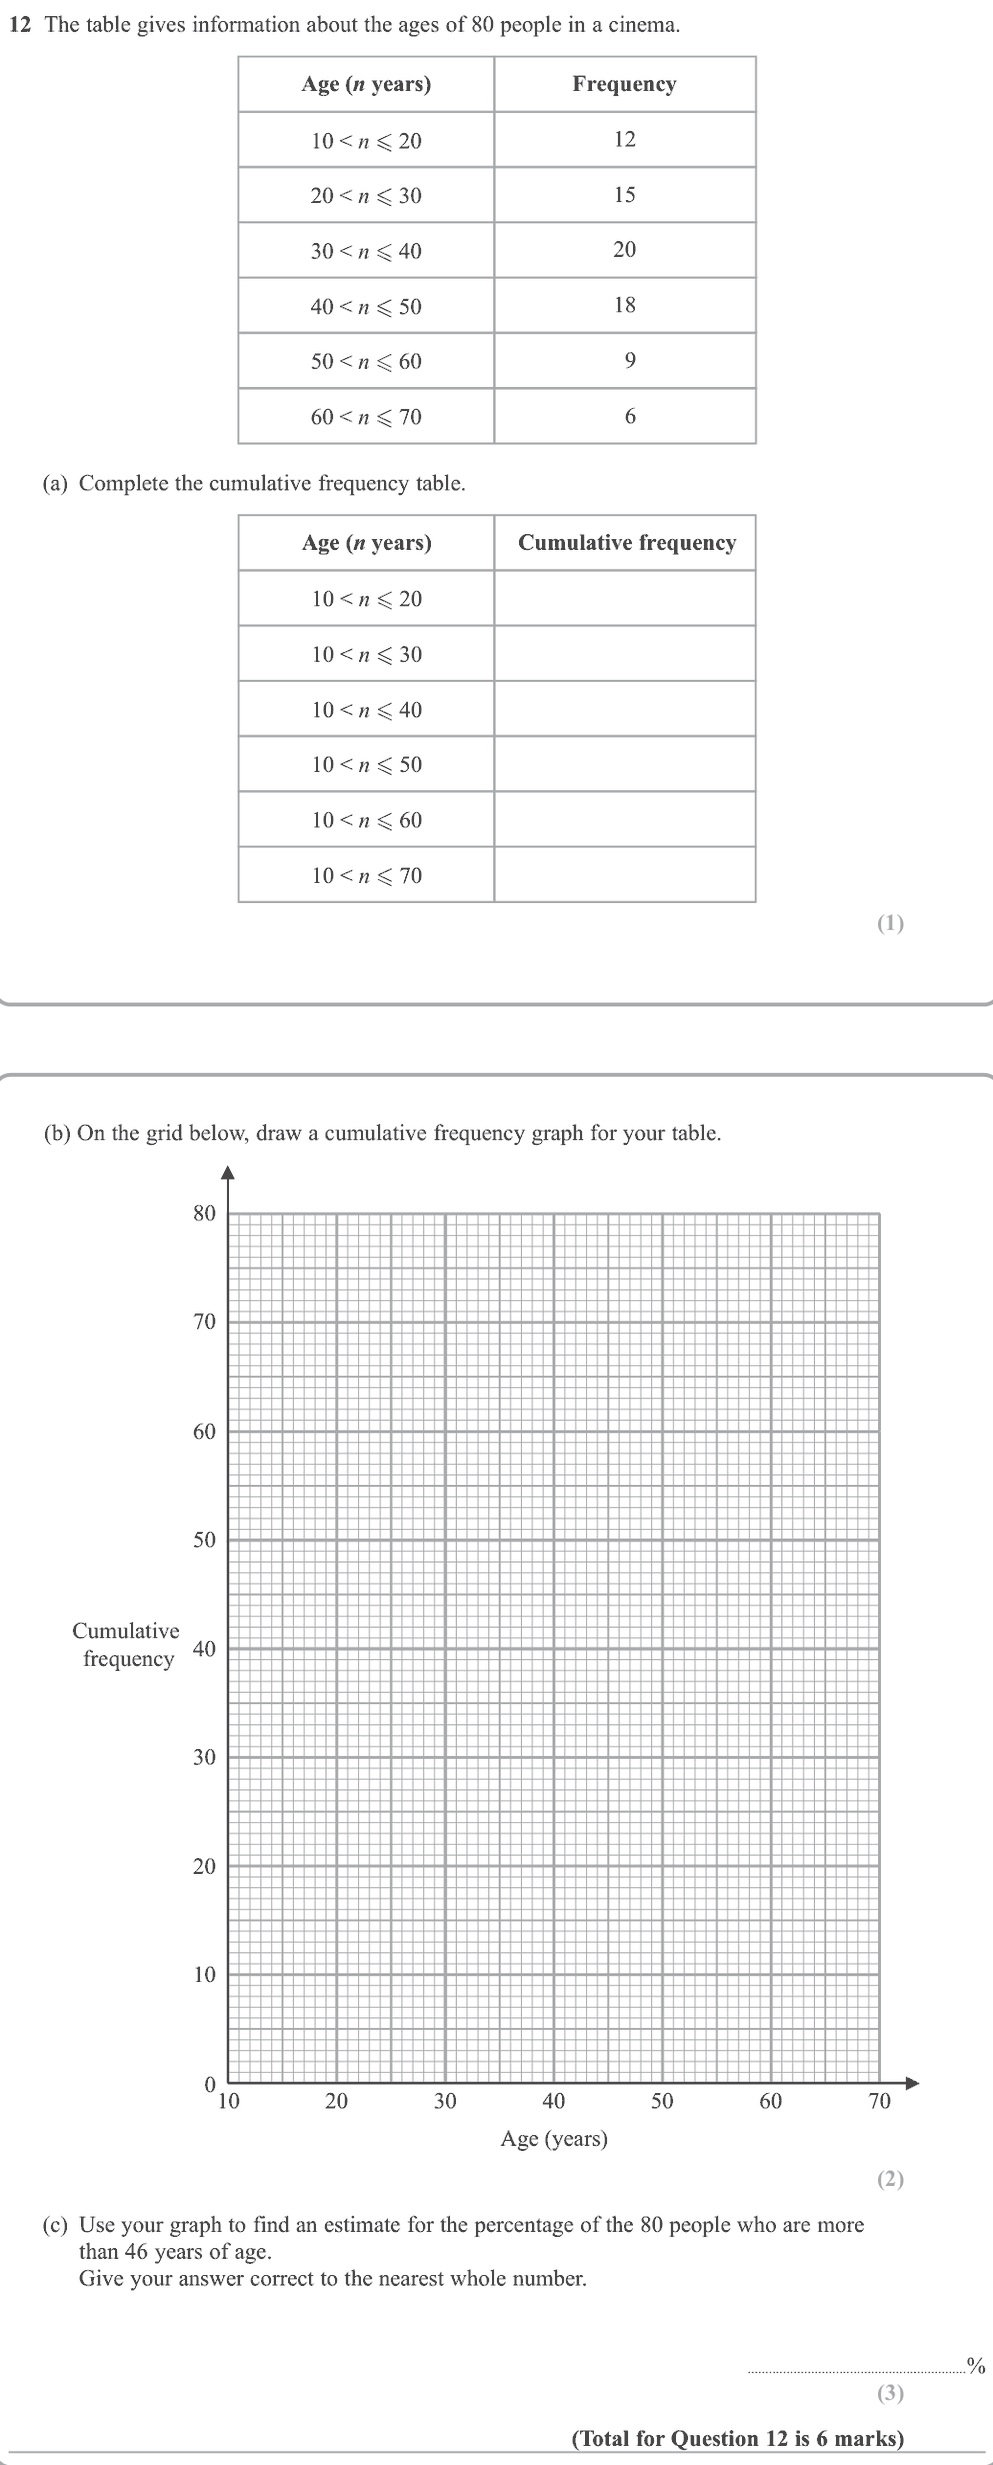
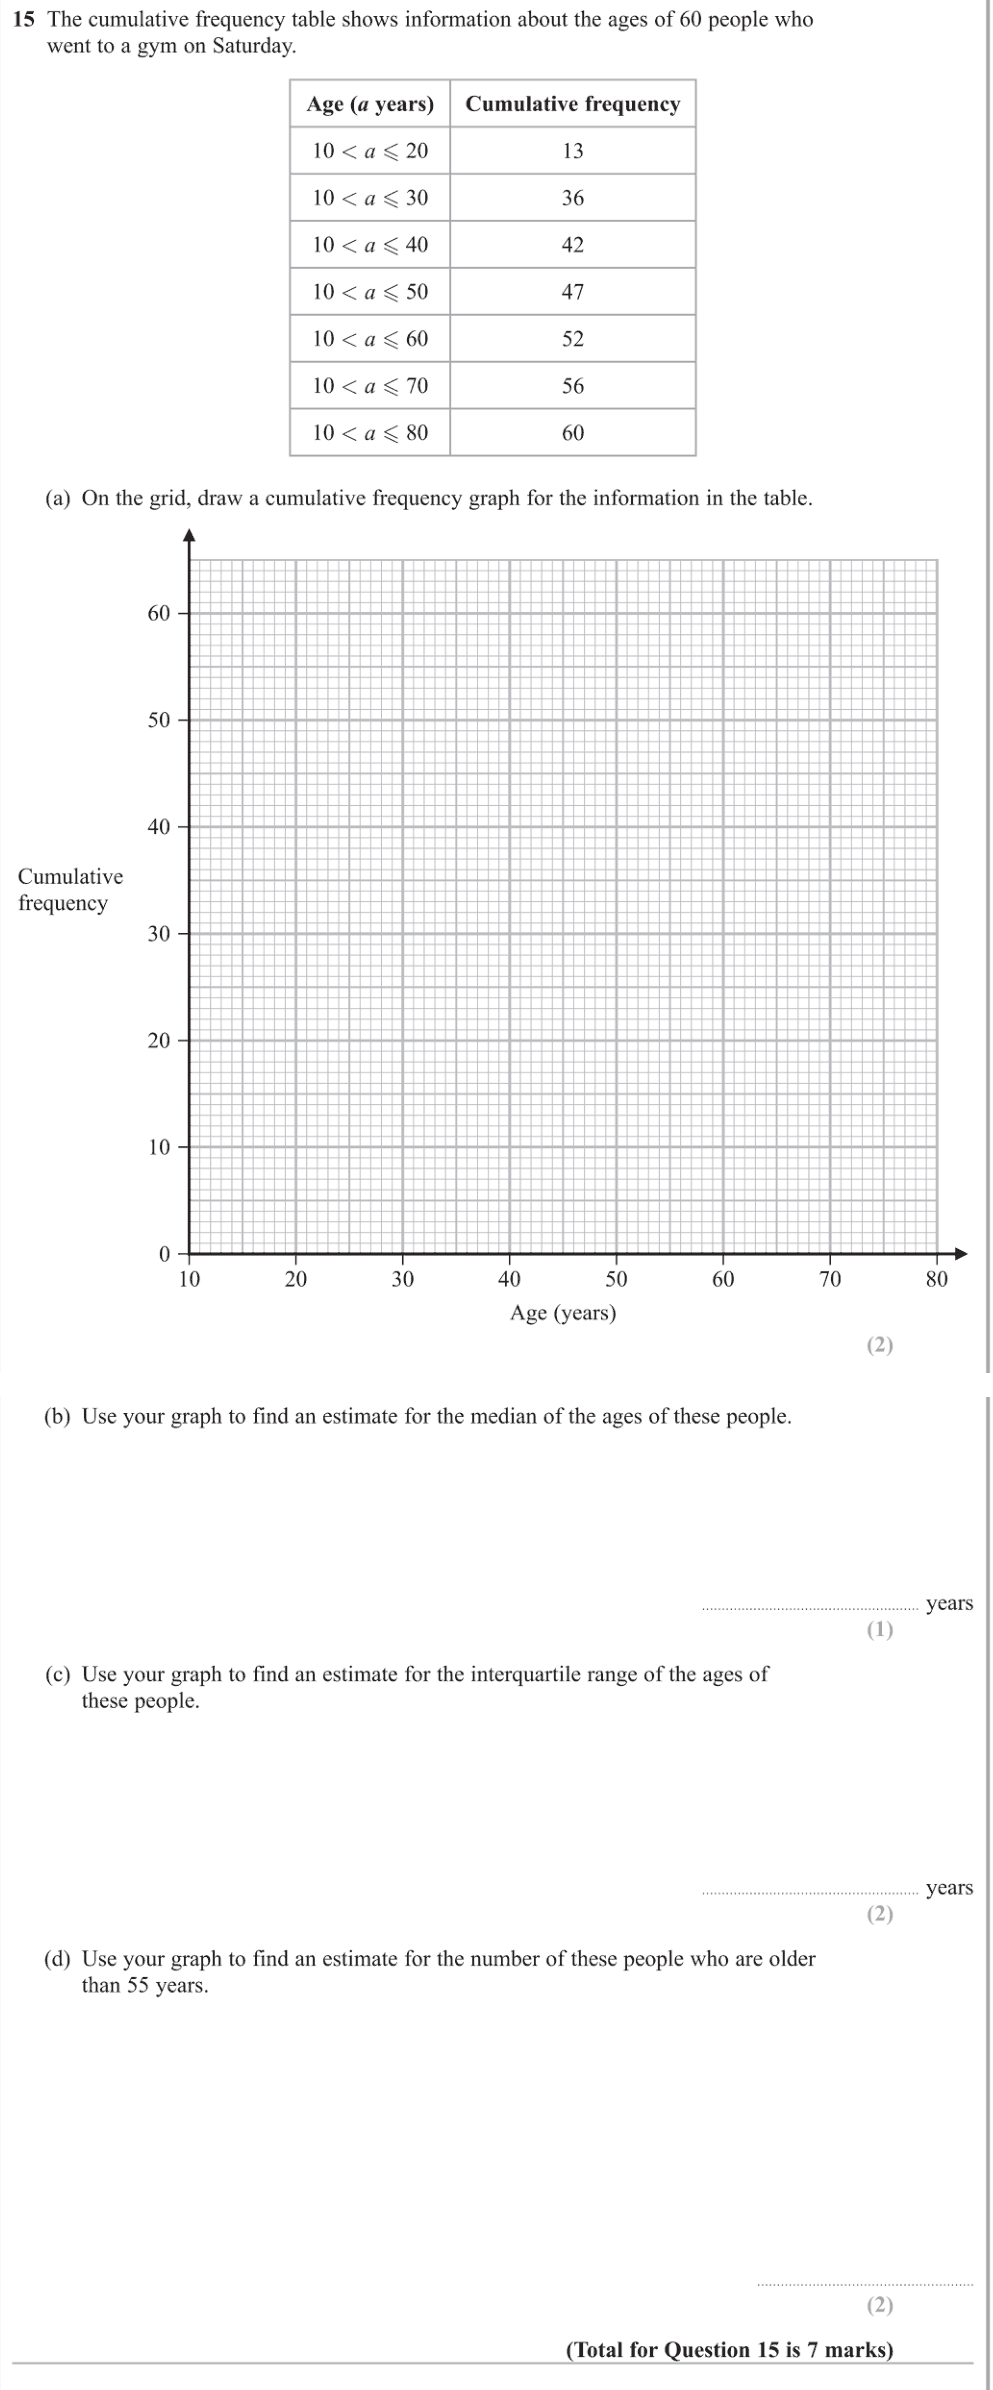
(a) Running totals
\[
12,\ 27,\ 47,\ 65,\ 74,\ 80
\]
(b) Plot at the upper class boundaries
Plot \((20,12),(30,27),(40,47),(50,65),(60,74),(70,80)\), start at \((10,0)\), and join with a smooth curve.
(c) People aged 46 or under
Read up from \(46\): about \(58\) people.
(c) Percentage older than 46
\(80-58=22\) people.
\[
\frac{22}{80}\times100\approx28\%
\]
(About \(26\%\) to \(30\%\) is accepted, depending on the curve.)
Final answer
(a) \(12, 27, 47, 65, 74, 80\) (c) about \(28\%\)
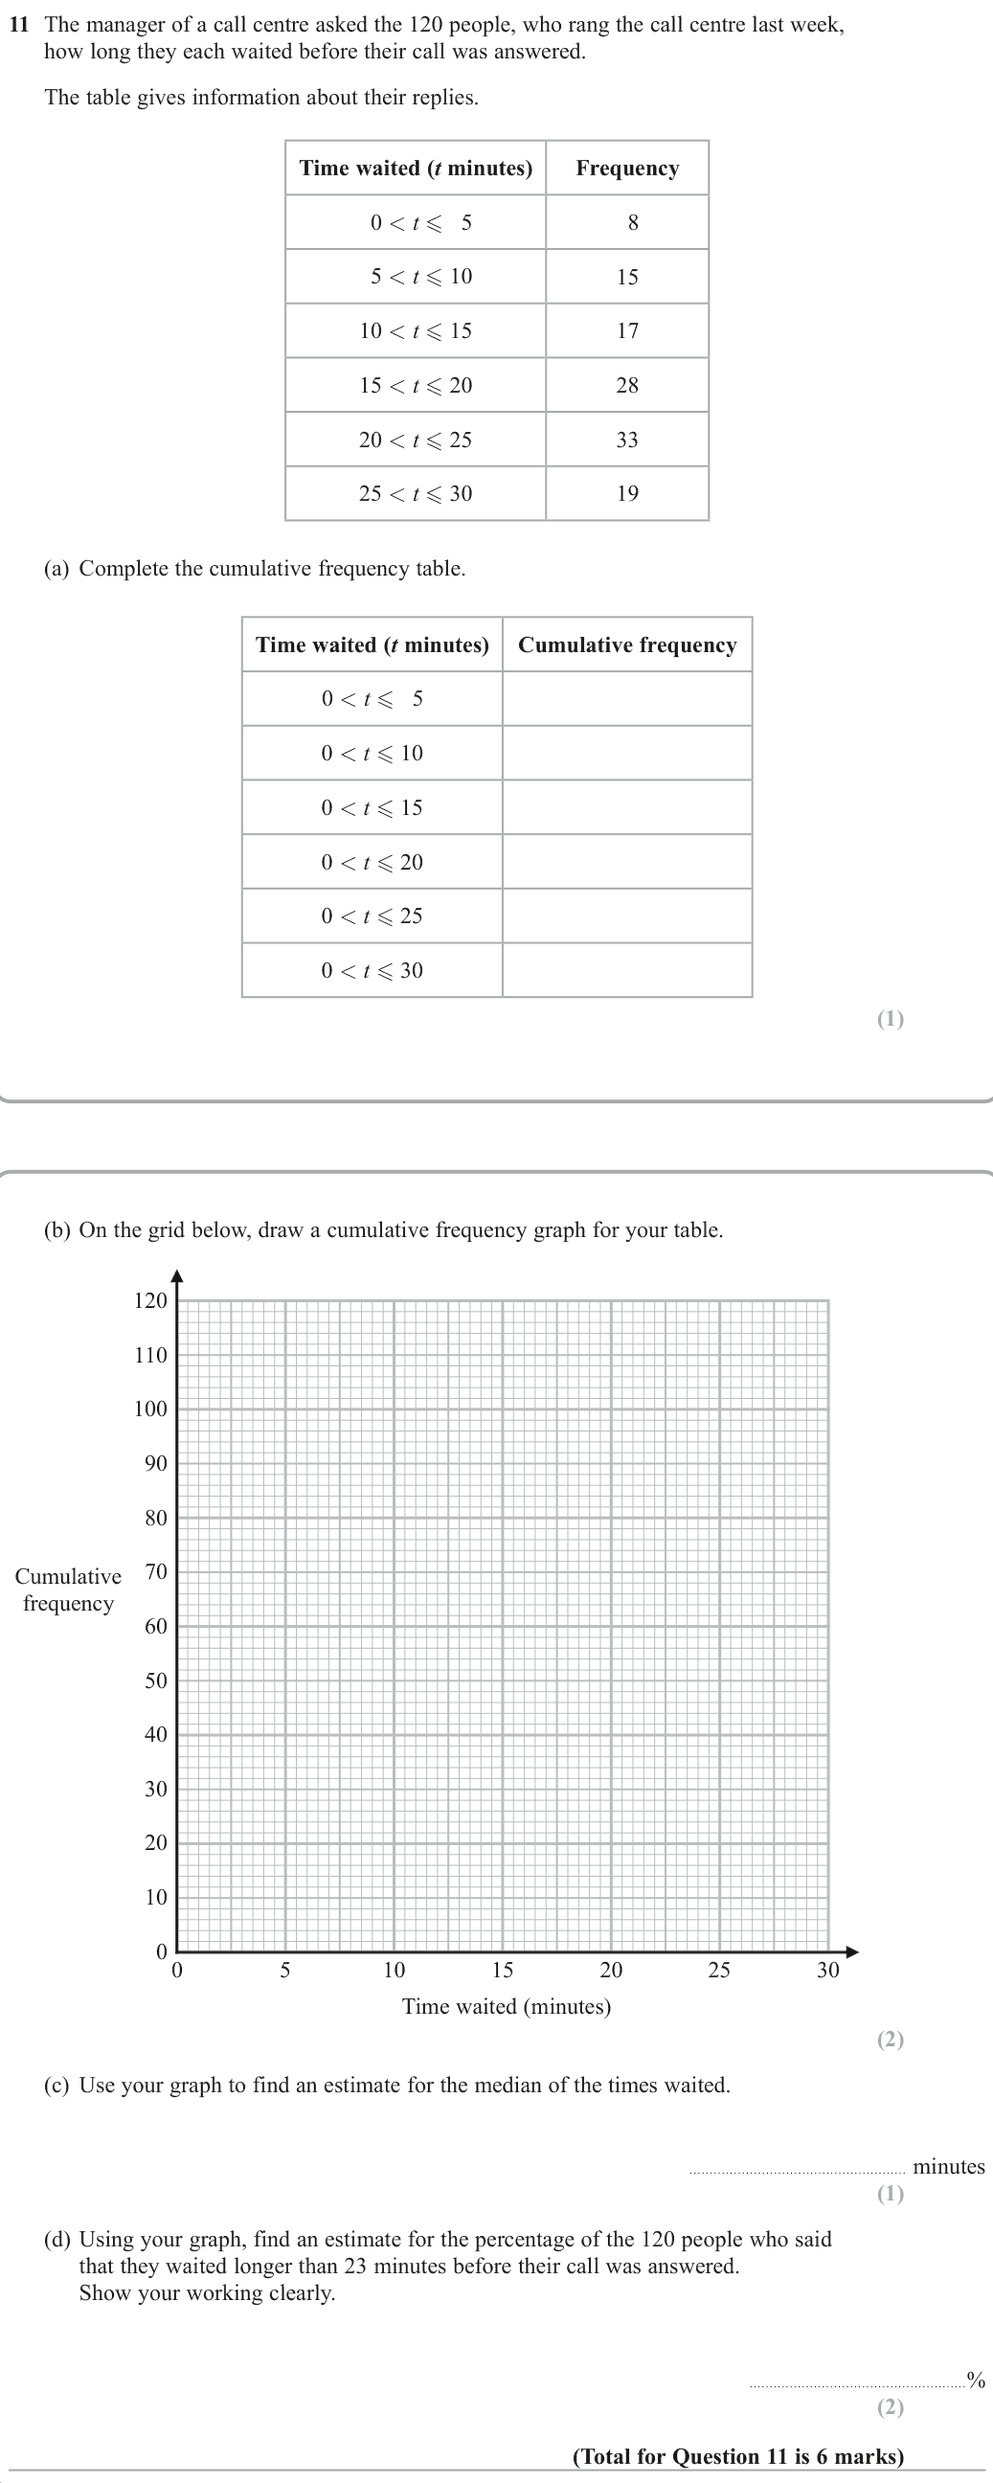
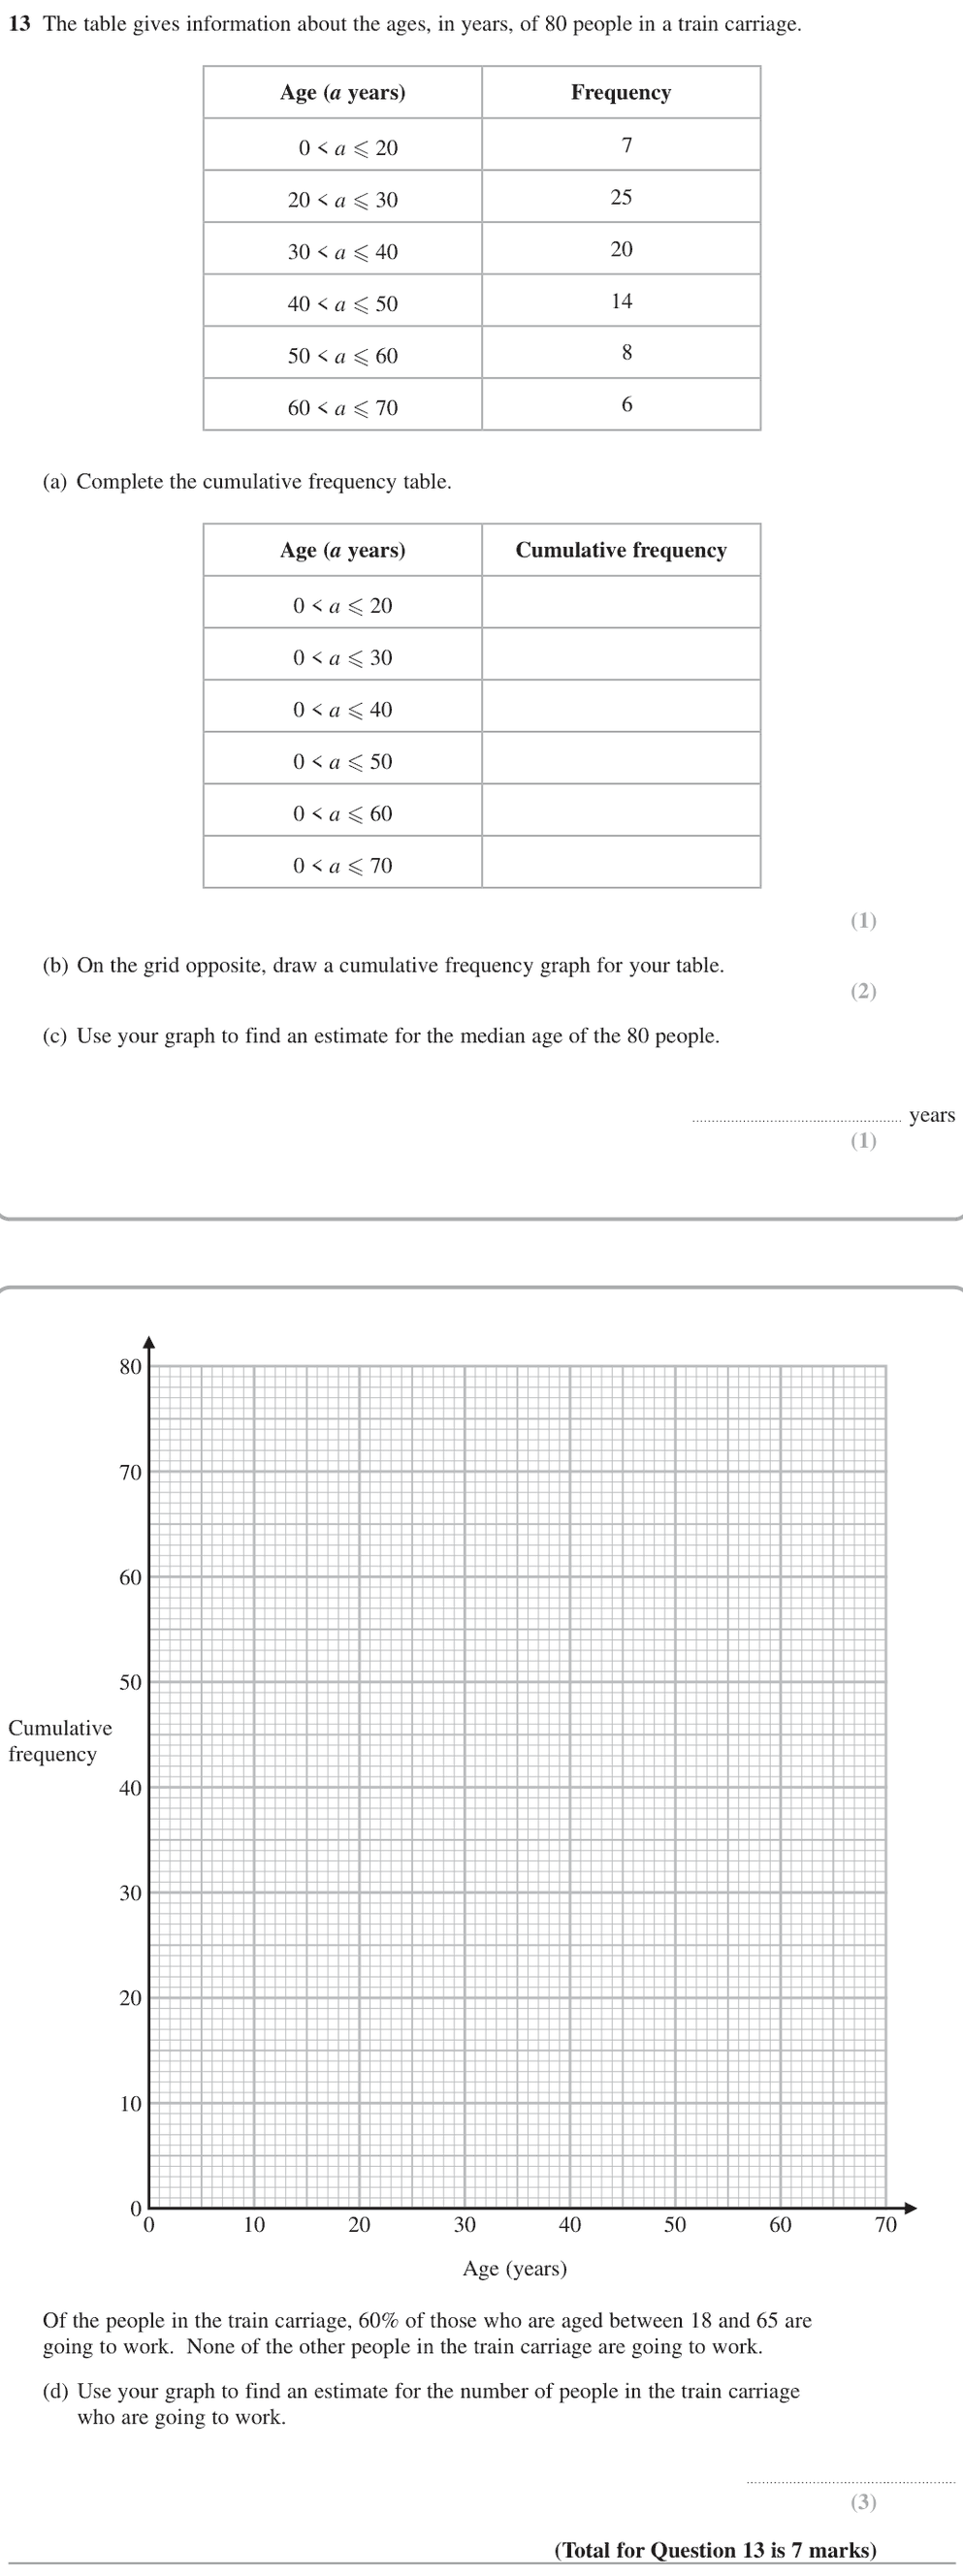
14. Jun 2025 P2H · Q13
Hard6 marksShow worked solution
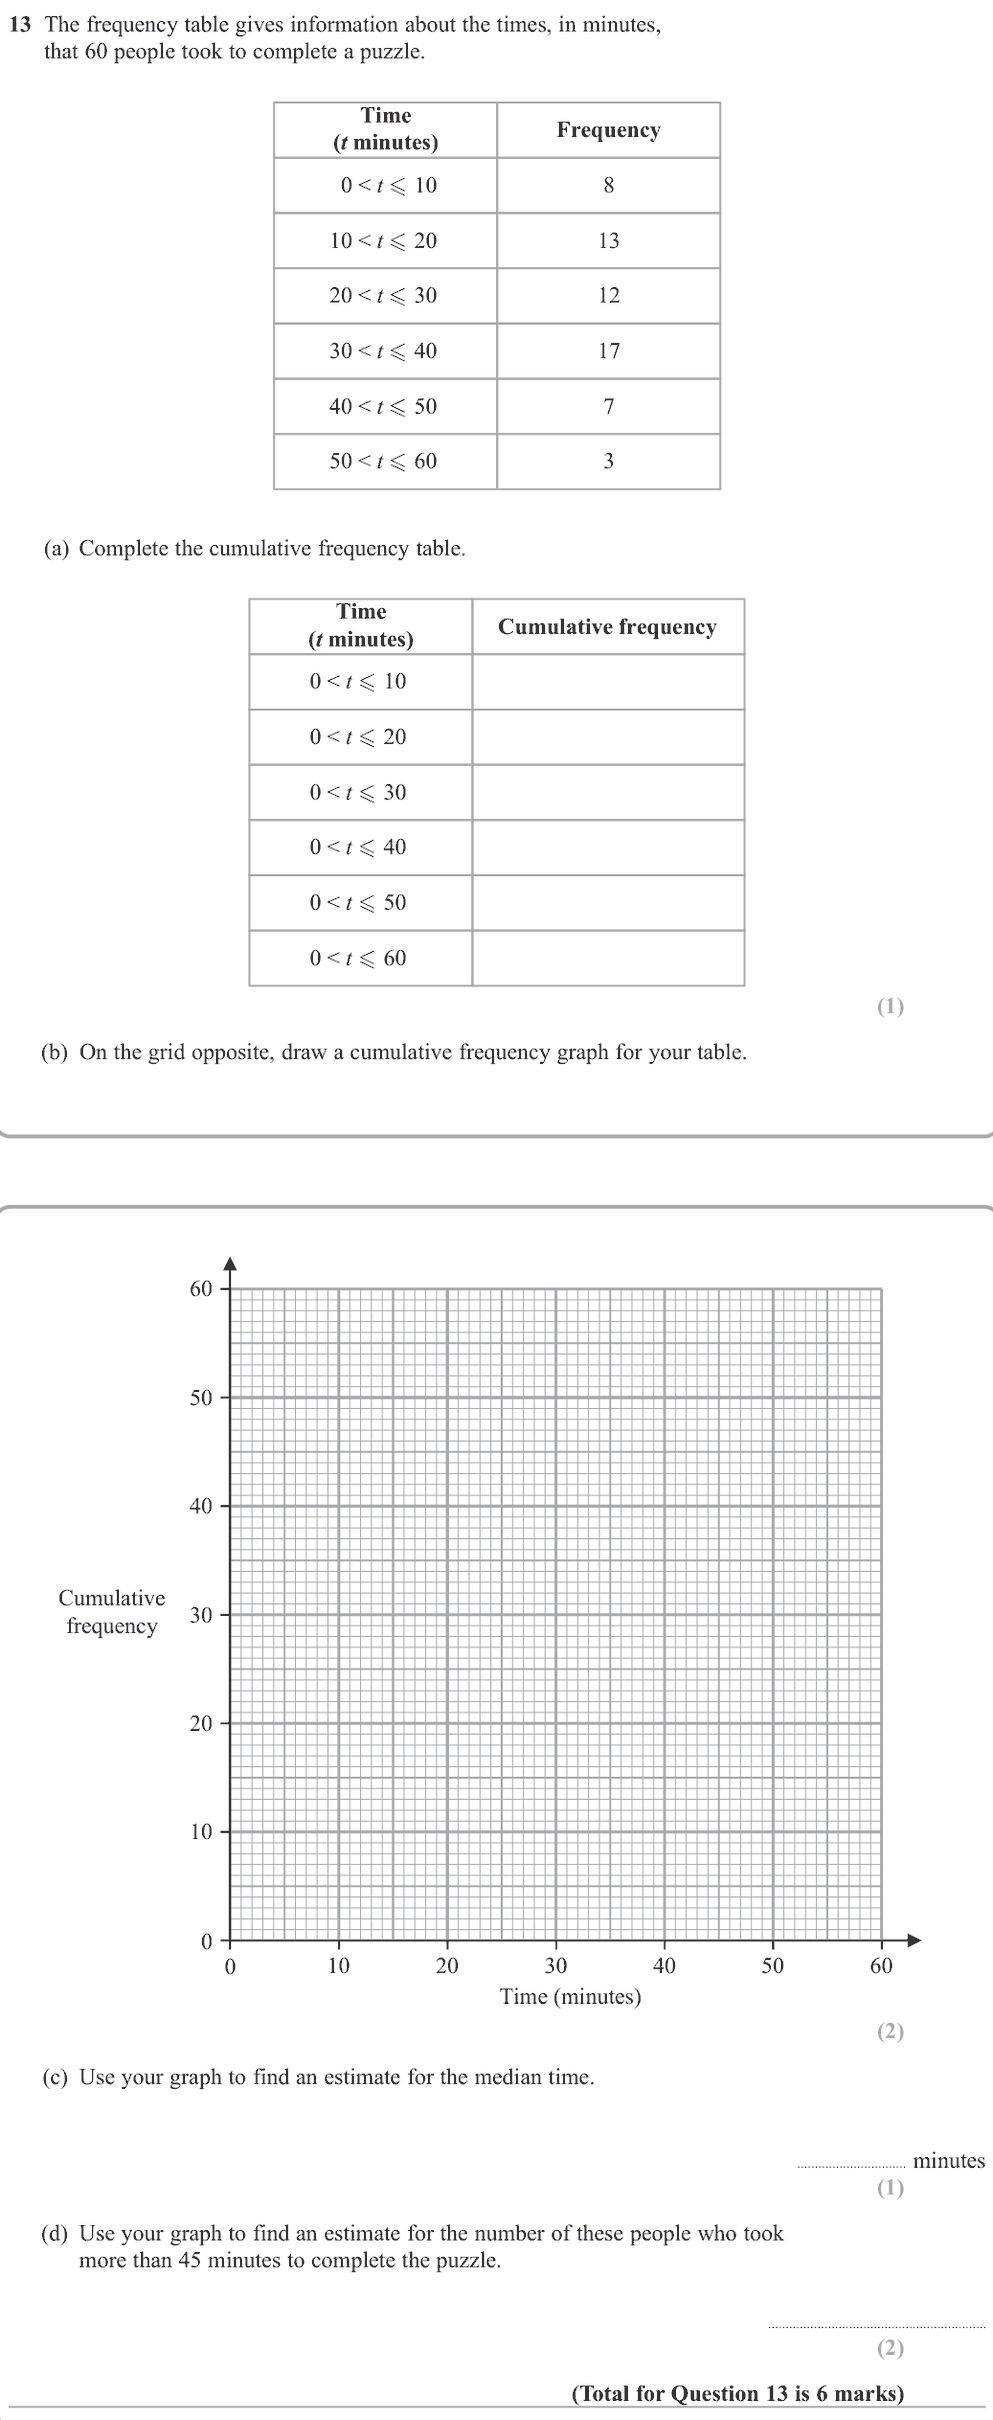
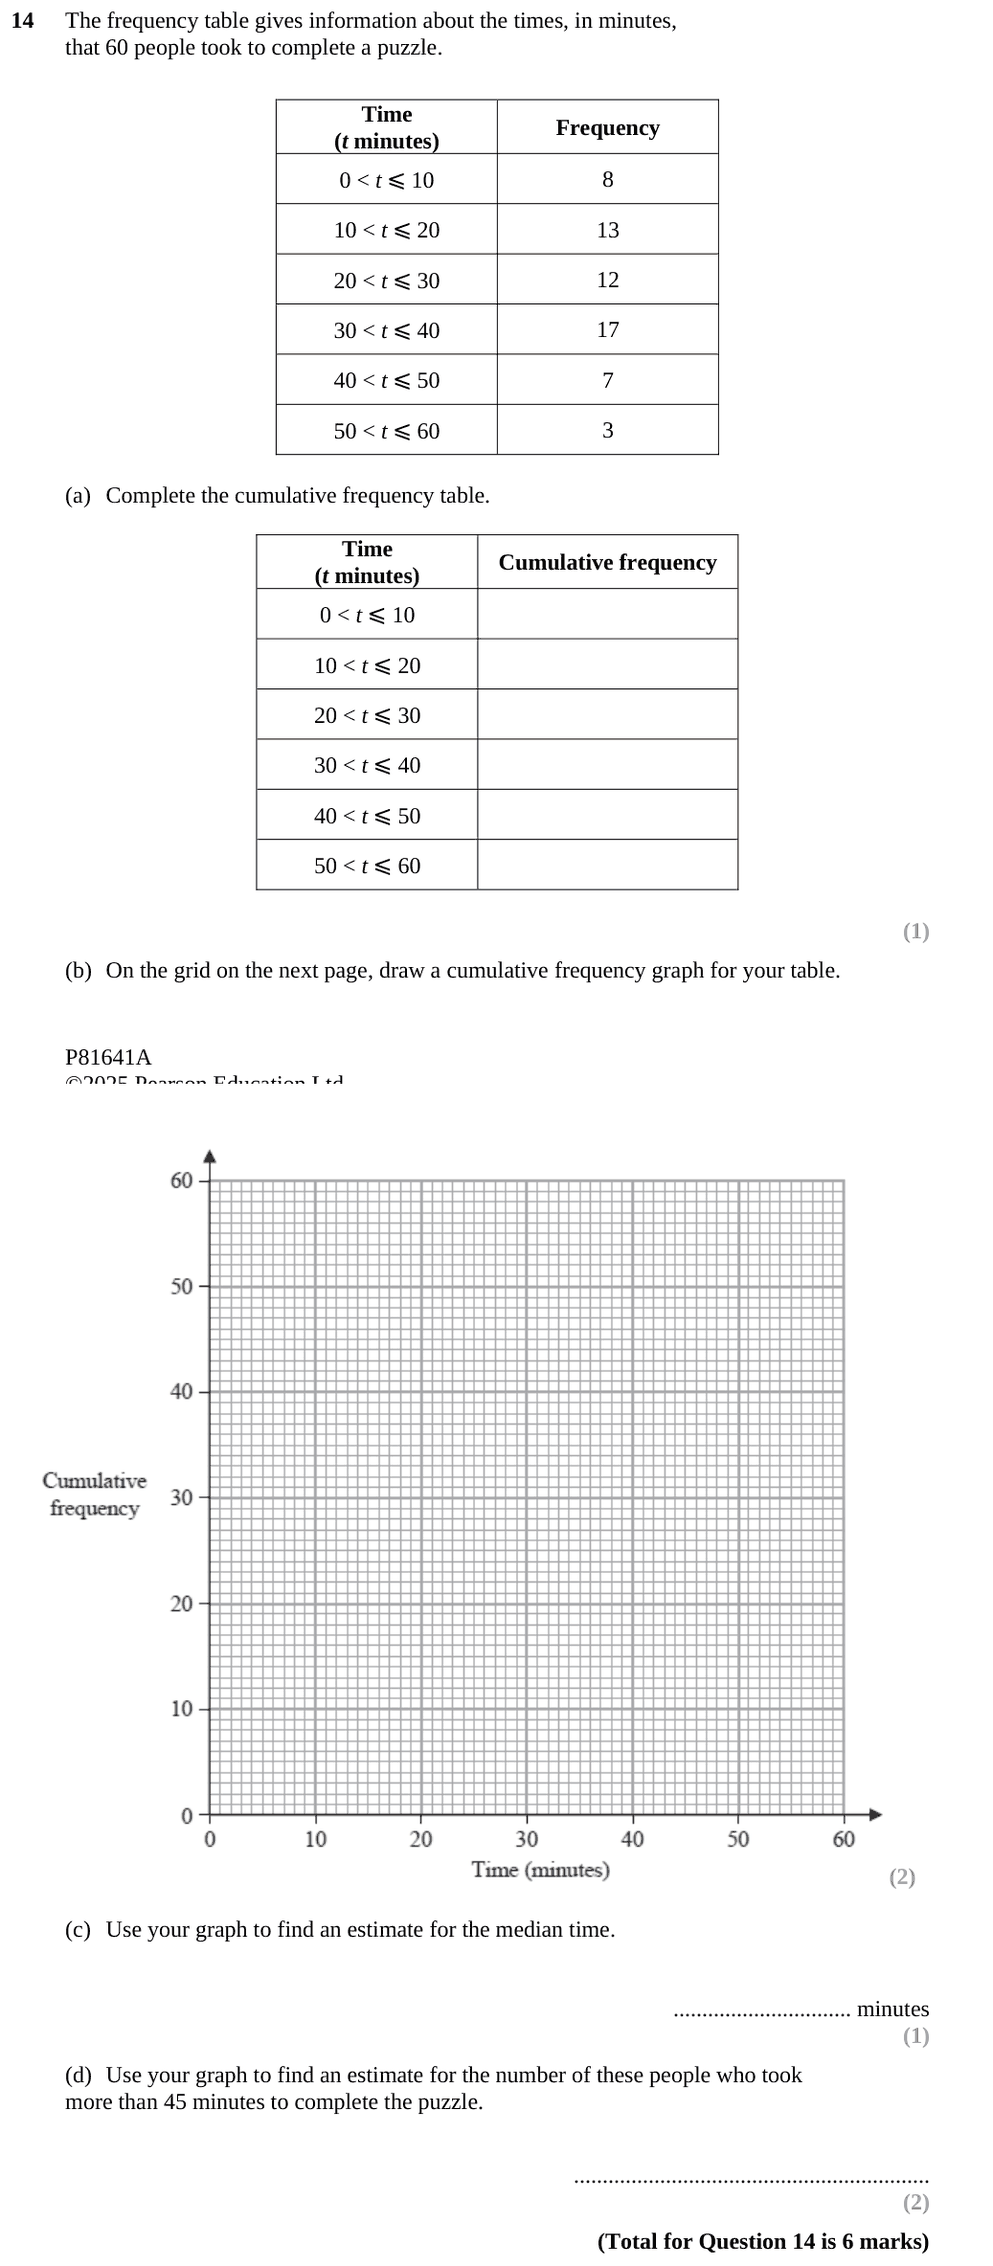
(a) Running totals
\[
8,\ 21,\ 33,\ 50,\ 57,\ 60
\]
(b) Plot at the upper class boundaries
Plot \((10,8),(20,21),(30,33),(40,50),(50,57),(60,60)\), start at \((0,0)\), and join with a smooth curve.
(c) Median
Read across from \(\frac{60}{2}=30\): about \(27.5\) minutes.
(d) More than 45 minutes
At \(45\) minutes the curve reads about \(54\), so about \(60-54=6\) people. (Answers from about \(5\) to \(8\) are accepted, depending on the curve.)
Final answer
(a) \(8, 21, 33, 50, 57, 60\) (c) about \(27.5\) minutes (d) about \(6\)
 Elite Mathematics