Skip to content
Elite Mathematics
IGCSE · 4MA1 · Topic

Graphs of Functions: past paper questions & worked solutions

Every Graphs of Functions question from the 4MA1 papers in our bank, 2020–2026, sorted from easiest to hardest. Try each one first, then open the worked solution.

31questions
114marks in total
48%of papers (26 of 54) include it
4/20/7easy / medium / hard

Questions, easiest first

Level is estimated from marks: 1–2 easy, 3–4 medium, 5+ hard.

1. Jun 2025 P2H · Q14

Easy2 marks
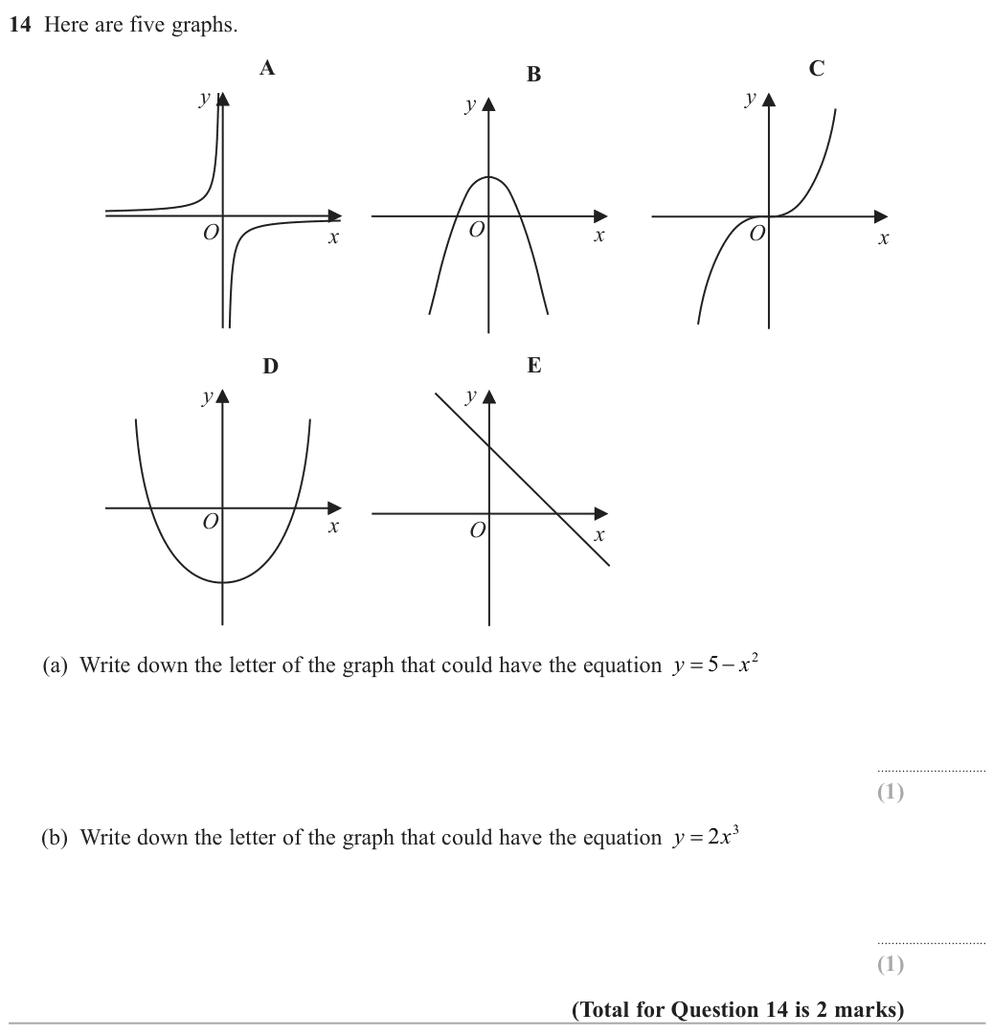
Jun 2025 P2H Question 14 (2 marks): Graphs of Functions – 14 Here are five graphs. E B A O y O y O O O y y x y x x x x D C (a) Write down the letter of the graph that could have the equation y x 5 2   (1) (b) Write down the letter of the graph that could have the equation y x =
Show worked solution
  1. (a)
    \[ y=5-x^2 \]
  2. This is a quadratic graph

    This is a quadratic graph with a negative coefficient of \(x^2\), so it is a downward-opening parabola.

  3. That is graph B

    That is graph **B**.

  4. (b)
    \[ y=2x^3 \]
  5. This is an increasing cubic

    This is an increasing cubic graph passing through the origin.

  6. That is graph C

    That is graph **C**.

Final answer

(a) B, (b) C.

2. Jun 2024 P2HR · Q16

Easy2 marks
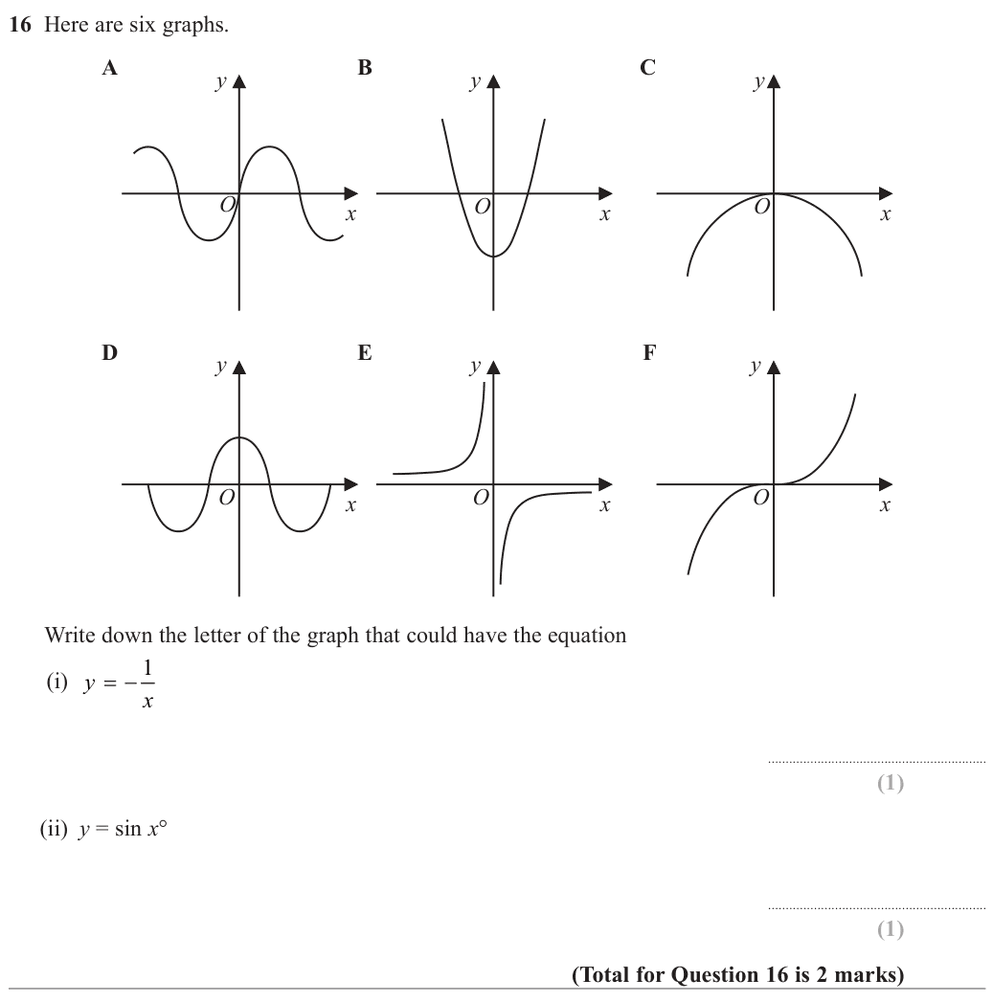
Jun 2024 P2HR Question 16 (2 marks): Graphs of Functions – 16 Here are six graphs. A D B E O y x O y x O y x O y x O y x O y C F x Write down the letter of the graph that could have the equation (i) y x 1    (1) (ii) y = sin x°    (1) (Total for Question 16 is 2 marks)
Show worked solution
  1. (i) has branches in quadrants

    (i) \[ y=-\frac1x \] has branches in quadrants II and IV, so it is **Graph E**.

  2. (ii) is the sine shaped

    (ii) \[ y=\sin x^\circ \] is the sine-shaped graph through the origin, so it is **Graph A**.

Final answer

(i) \(E\), (ii) \(A\).

3. Jun 2024 P2H · Q25

Easy2 marks
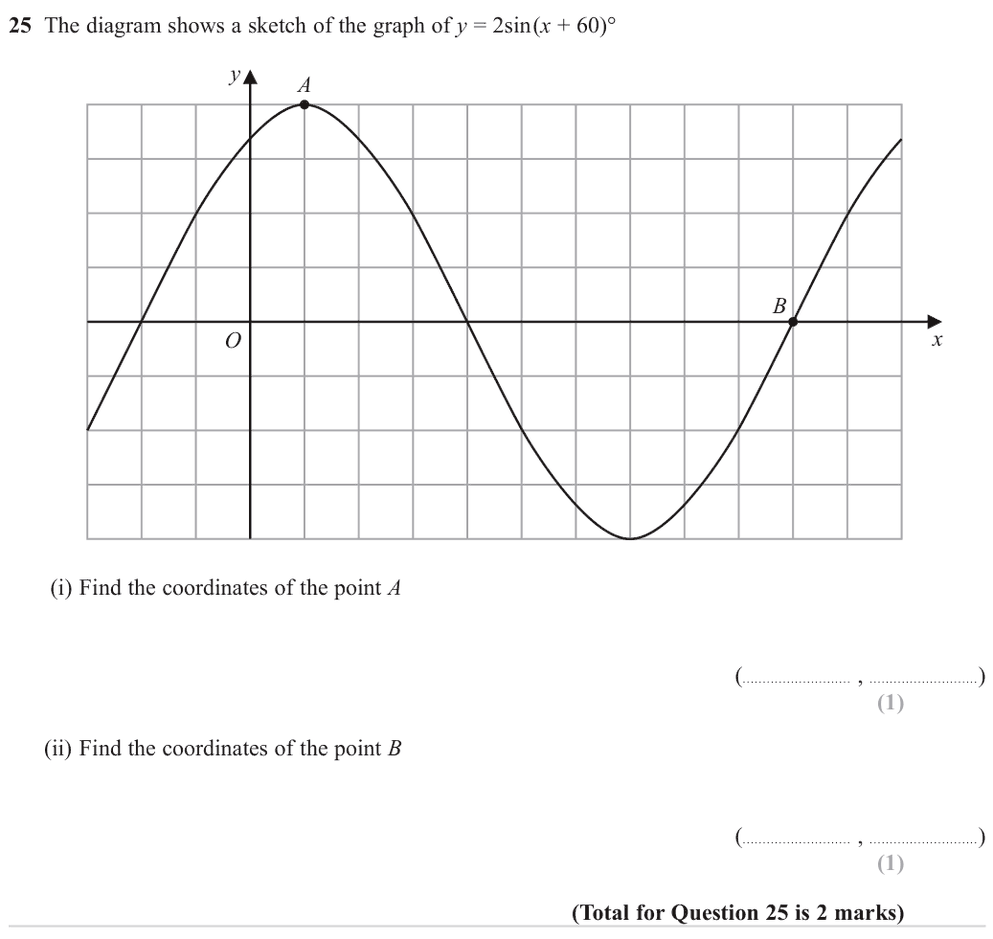
Jun 2024 P2H Question 25 (2 marks): Graphs of Functions – 25 The diagram shows a sketch of the graph of y = 2sin (x + 60)° O A B x y (i) Find the coordinates of the point A (  ,  ) (1) (ii) Find the coordinates of the point B (  ,  ) (1) (Total for Question 25 is 2 marks)
Show worked solution
  1. Use trigonometry
    \[ y=2\sin(x+60)^\circ \]
  2. Point is the maximum point

    Point \(A\) is the maximum point.

  3. The maximum value is
    \[ y=2 \]
  4. This happens when
    \[ x+60=90 \]
    \[ x=30 \]
  5. Read the graph

    So

    \[ A=(30,2) \]
  6. Point is the positive intercept

    Point \(B\) is the positive \(x\)-intercept after the minimum.

    \[ 2\sin(x+60)^\circ=0 \]
    \[ \sin(x+60)^\circ=0 \]
  7. Read the graph

    For this point,

    \[ x+60=360 \]
    \[ x=300 \]
  8. Read the graph

    So

    \[ B=(300,0) \]
Final answer

\(A=(30,2),\ B=(300,0)\)

4. Jun 2022 P2H · Q23

Easy2 marks
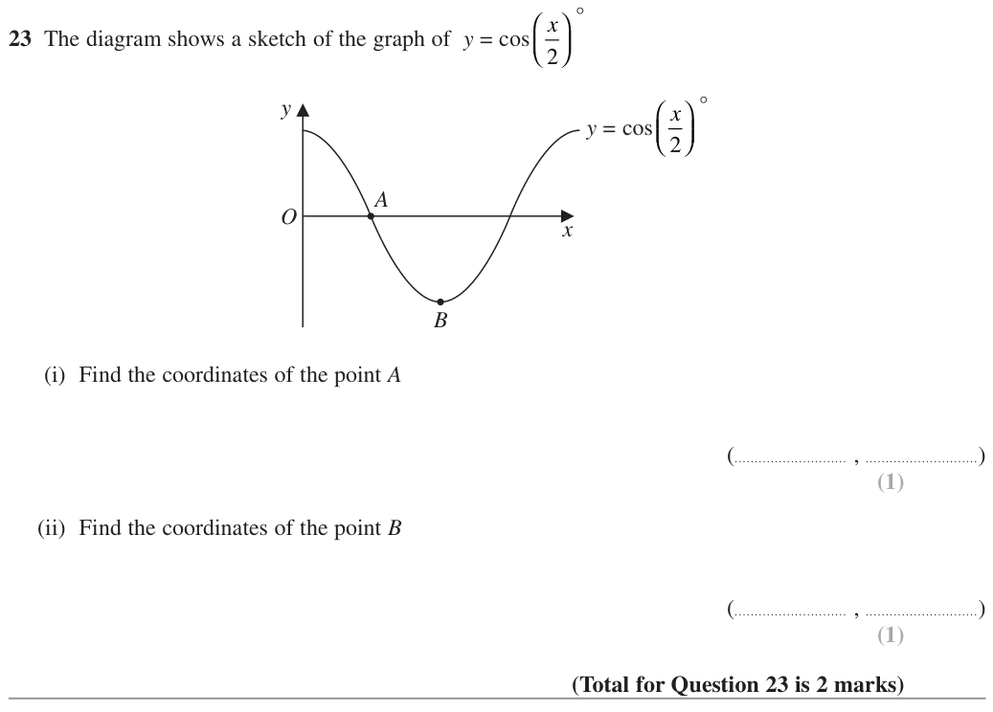
Jun 2022 P2H Question 23 (2 marks): Graphs of Functions – 23 The diagram shows a sketch of the graph of y = cos x 2     ° y x B A y = cos x 2     ° O (i) Find the coordinates of the point A (  ,  ) (1) (ii) Find the coordinates of the point B (  ,  ) (1) (Total for
Show worked solution
  1. The graph is
    \[ y=\cos\left(\frac{x}{2}\right)^\circ \]
  2. Point is the first positive

    Point \(A\) is the first positive \(x\)-intercept, so \(y=0\).

    \[ \cos\left(\frac{x}{2}\right)=0 \]
    \[ \frac{x}{2}=90^\circ \]
    \[ x=180 \]
  3. Read the graph

    So

    \[ A=(180,0) \]
  4. Point is the minimum point

    Point \(B\) is the minimum point.

  5. The minimum value of cosine

    The minimum value of cosine is \(-1\), which occurs when

    \[ \frac{x}{2}=180^\circ \]
    \[ x=360 \]
  6. Read the graph

    So

    \[ B=(360,-1) \]
Final answer

\(A=(180,0),\ B=(360,-1)\)

5. Nov 2025 4WM2H · Q25

Medium3 marks
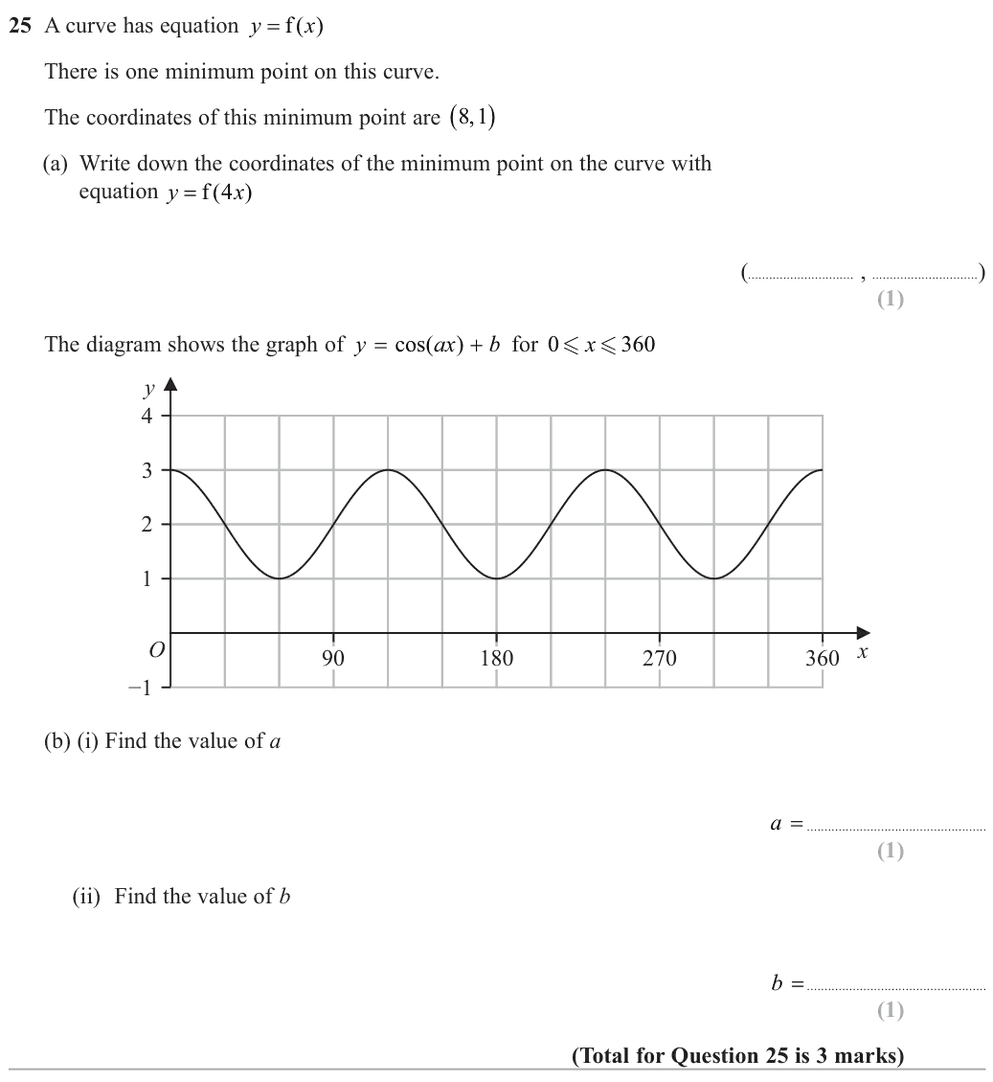
Nov 2025 4WM2H Question 25 (3 marks): Graphs of Functions – 25 A curve has equation y x = f ( ) There is one minimum point on this curve. The coordinates of this minimum point are 8 1 ,  (a) Write down the coordinates of the minimum point on the curve with equation y x = f ( ) 4
Show worked solution
  1. The transformation y f (4

    The transformation *y* = *f*(4*x*) represents a horizontal stretch by a scale factor of $\\frac{1}{4}$. The x-coordinate is multiplied by $\\frac{1}{4}$ while the y-coordinate stays the same. $$\\text{New minimum} = \\left(8 \\times \\frac{1}{4}, 1\\right) = (2, 1)$$

  2. Answer

    (2,1)

    **Step 1: Find the vertical shift *b*.** The standard *y* = cos (*x*) graph fluctuates between  − 1 and 1, centered at *y* = 0. The given graph fluctuates between a minimum of *y* = 1 and a maximum of *y* = 3. The center line is $\\frac{3 + 1}{2} = 2$. Therefore, *b* = 2.

    **Step 2: Find the frequency multiplier *a*.** The period of the given graph completes one full cycle between *x* = 0 and *x* = 90<sup>∘</sup> (it starts at 3, dips to 1, and returns to 3 at 90<sup>∘</sup>). The standard cosine period is 360<sup>∘</sup>. $$\\text{Period} = \\frac{360^\\circ}{a}$$ $$90^\\circ = \\frac{360^\\circ}{a} \\implies a = 4$$

Final answer

*a* = 4,  *b* = 2

6. Jun 2025 P1H · Q10

Medium3 marks
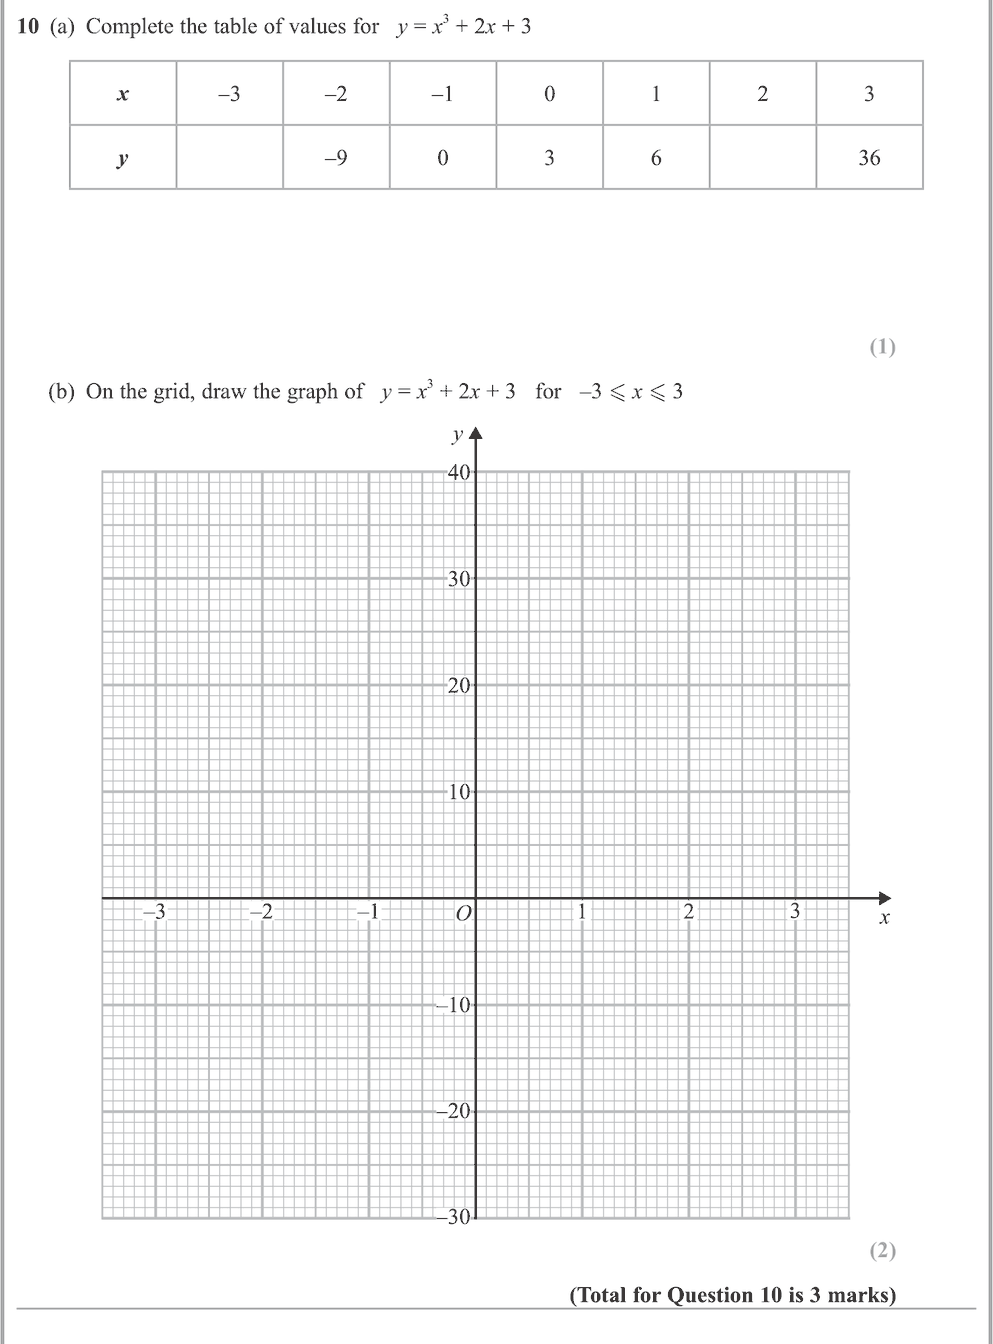
Jun 2025 P1H Question 10 (3 marks): Graphs of Functions – 10 (a) Complete the table of values for y = x 3 + 2x + 3 x -3 -2 -1 0 1 2 3 y -9 0 3 6 36 (1) (b) On the grid, draw the graph of y = x 3 + 2x + 3 for -3 < x < 3 -10 -20 -30 -2 -3 -1 2 1 3 10 O 20 30 40 y x (2) (Total for
Show worked solution
  1. Read the graph
    \[ y=x^3+2x+3 \]
  2. The completed table is

    The completed table is:

    \[ \begin{array}{c|rrrrrrr} x&-3&-2&-1&0&1&2&3\\ \hline y&-30&-9&0&3&6&15&36 \end{array} \]
  3. Plot the points and join

    Plot the points and join them with a smooth cubic curve.

Final answer

Missing values are \(-30,15\).

7. Jun 2025 P2HR · Q25

Medium3 marks
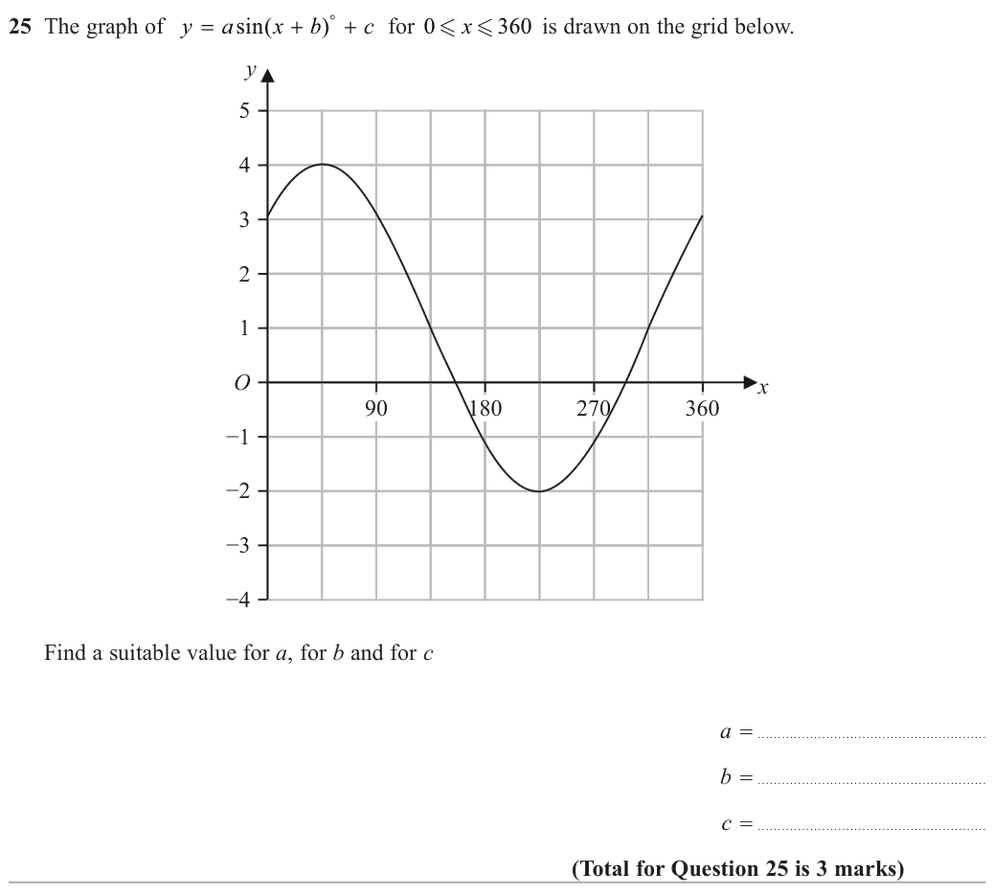
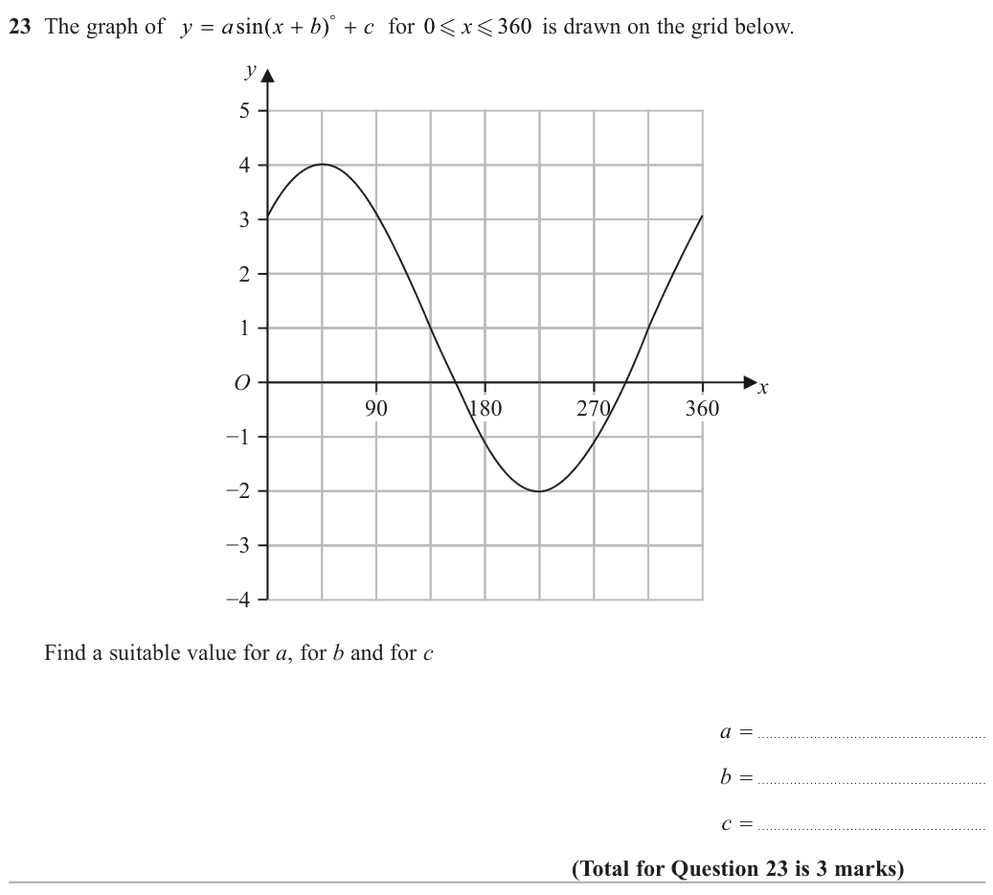
Jun 2025 P2HR Question 25 (3 marks): Graphs of Functions – 25 The graph of y a x b c sin( ) for 0 360 < < x is drawn on the grid below. -2 x y -3 -4 O 1 -1 2 3 4 5 90 180 270 360 Find a suitable value for a, for b and for c a =   b =   c =   (Total for Question 25 is 3 marks)
Show worked solution
  1. Read the graph

    From the graph,

    \[ \text{maximum}=4 \]
    \[ \text{minimum}=-2 \]
  2. The amplitude is
    \[ a=\frac{4-(-2)}{2}=3 \]
  3. The centre line is
    \[ c=\frac{4+(-2)}{2}=1 \]
  4. Use trigonometry

    The maximum is about \(45^\circ\). For a sine graph, a maximum happens when the angle inside the sine is \(90^\circ\), so

    \[ 45+b=90 \]
    \[ b=45 \]
Final answer

\(a=3,\ b=45,\ c=1\)

8. May 2025 4WM1H · Q13

Medium3 marks
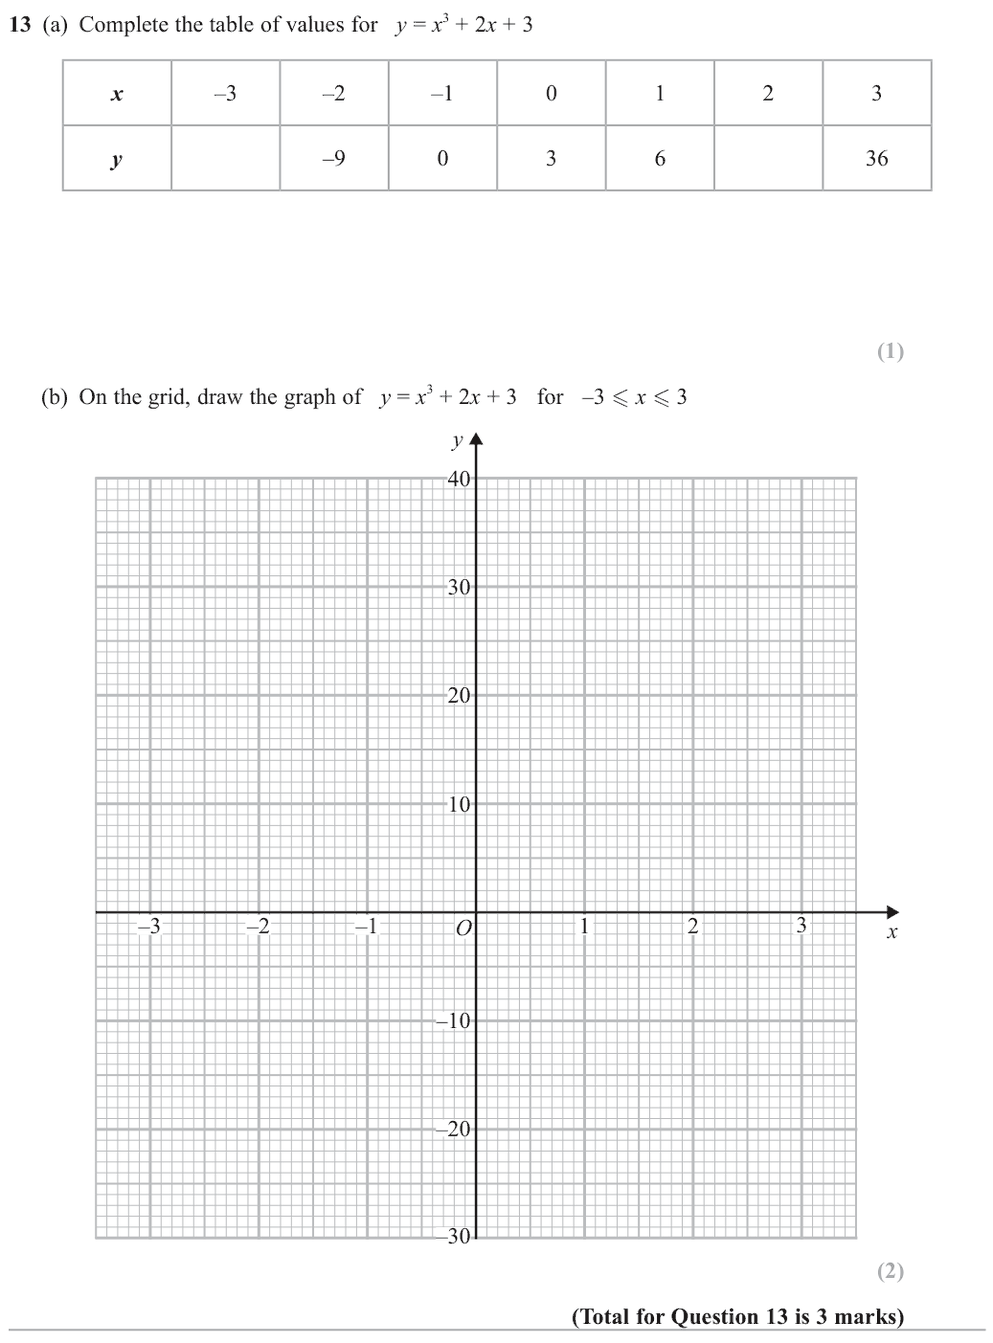
May 2025 4WM1H Question 13 (3 marks): Graphs of Functions – 13 (a) Complete the table of values for y = x3 + 2x + 3 x –3 –2 –1 0 1 2 3 y –9 0 3 6 36 (1) (b) On the grid, draw the graph of y = x3 + 2x + 3 for –3  x  3 –10 –20 –30 –2 –3 –1 2 1 3 10 O 20 30 40 y x (2) (Total for Q
Show worked solution
  1. Use

    Use \(y=x^3+2x+3\).

  2. Read the graph

    For \(x=-3\),

    \[ y=(-3)^3+2(-3)+3=-30 \]
  3. Read the graph

    For \(x=2\),

    \[ y=2^3+2(2)+3=15 \]
  4. Read the graph

    So the table is

    \[ \begin{array}{c|rrrrrrr} x&-3&-2&-1&0&1&2&3\\ \hline y&-30&-9&0&3&6&15&36 \end{array} \]
  5. Plot these points and draw

    Plot these points and draw a smooth cubic curve through them.

Final answer

Missing values \(-30\) and \(15\); draw the smooth curve through the table points.

9. May 2025 4WM2HR · Q19

Medium3 marks
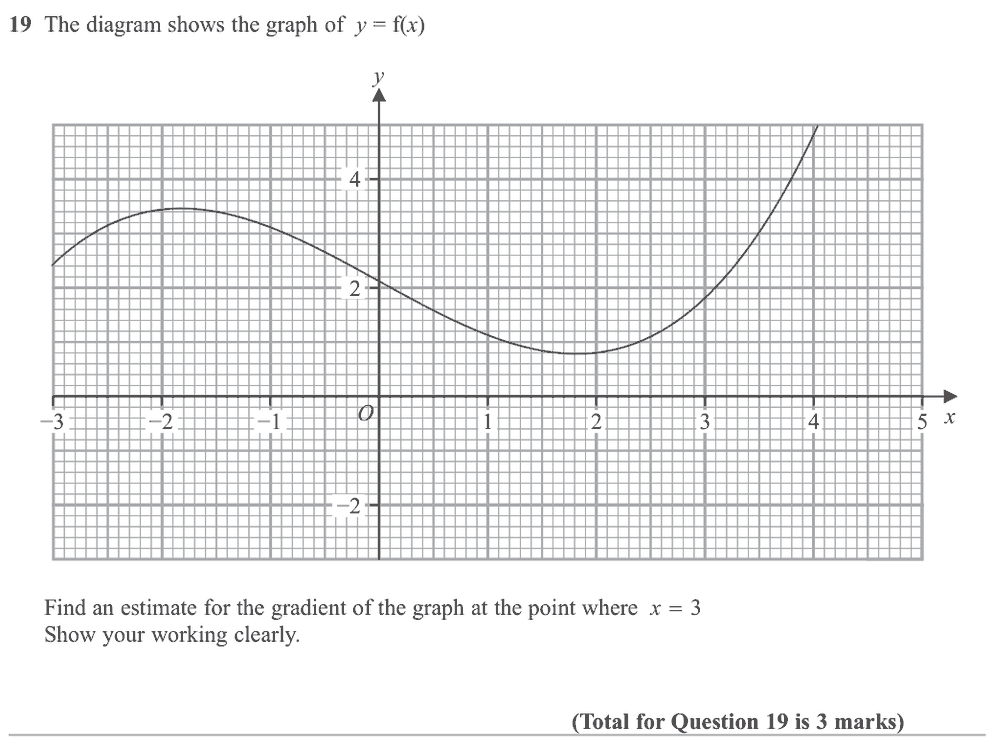
May 2025 4WM2HR Question 19 (3 marks): Graphs of Functions – 19 The diagram shows the graph of y = f(x) y x O −2 −1 −3 1 2 3 4 5 −2 2 4 Find an estimate for the gradient of the graph at the point where x = 3 Show your working clearly.   (Total for Question 19 is 3 marks)
Show worked solution
  1. Required

    Estimate the gradient of *y* = *f*(*x*) at the point where *x* = 3.

  2. Draw a tangent to the

    Draw a tangent to the curve at *x* = 3. From the graph, a suitable tangent passes through approximately (1, −2) and (5, 6):

  3. Calculate gradient of the tangent

    Calculate gradient of the tangent: $$\\text{Gradient} = \\frac{\\Delta y}{\\Delta x} = \\frac{6-(-2)}{5-1} = \\frac{8}{4} = 2$$

  4. Note

    Answers in the range 1 to 3 are typically accepted. Draw the tangent triangle as large as possible for the most accurate estimate.

Final answer

Gradient  ≈ 2 at *x* = 3

10. May 2025 4WM2HR · Q23

Medium3 marks
May 2025 4WM2HR Question 23 (3 marks): Graphs of Functions – 23 The graph of y a x b c sin( ) for 0 360   x is drawn on the grid below. −2 x y −3 −4 O 1 −1 2 3 4 5 90 180 270 360 Find a suitable value for a, for b and for c a =   b =   c =   (Total for Question 23 is 3 marks)
Show worked solution
  1. Required

    The graph of *y* = *a*sin (*x*+*b*)<sup>∘</sup> + *c* for 0 ≤ *x* ≤ 360 is shown. Find suitable values for *a*, *b*, and *c*.

  2. Read the maximum and minimum

    Read the maximum and minimum values from the graph to find the **amplitude** *a* and **vertical shift** *c*: $$a = \\frac{\\text{max}-\\text{min}}{2} = \\frac{4-(-2)}{2} = 3 \\qquad c = \\frac{\\text{max}+\\text{min}}{2} = \\frac{4+(-2)}{2} = 1$$

  3. Find the phase shift b

    Find the **phase shift** *b*. The standard sin  has its peak at *x* = 90°. From the graph, the maximum occurs at *x* ≈ 45°: *x* + *b* = 90° ⟹ 45° + *b* = 90° ⟹ *b* = 45°

  4. Verify at x 0 consistent

    Verify at *x* = 0: $y = 4\\sin(0+45)° = 4\\times\\frac{\\sqrt{2}}{2} \\approx 2.83$ — consistent with graph

  5. Note

    The period of the graph is still 360° (unchanged), so no horizontal stretch is applied.

Final answer

*a* = 3,*b* = 45,*c* = 1

11. Jun 2023 P2HR · Q12

Medium3 marks
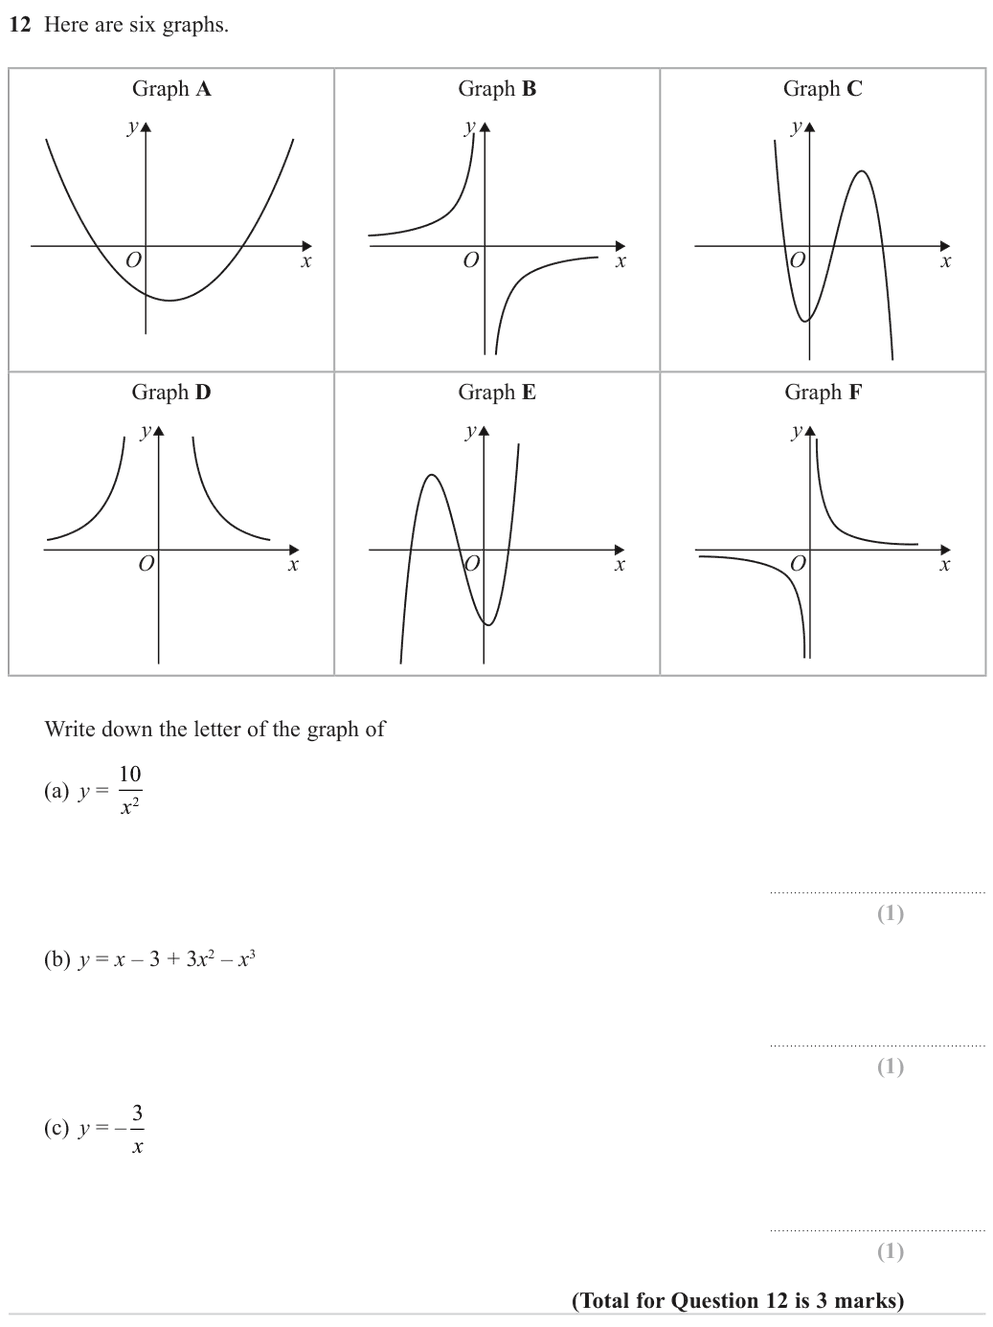
Jun 2023 P2HR Question 12 (3 marks): Graphs of Functions – 12 Here are six graphs. Graph A O y x Graph B O y x Graph C O y x Graph D O y x Graph E O y x Graph F O y x Write down the letter of the graph of (a) y = 10 2x   (1) (b) y = x - 3 + 3x2 - x3   (1) (c) y = - 3 x   (1) (To
Show worked solution
  1. Solve equation

    For \[ y=\frac{10}{x^2} \] the graph is positive on both sides and symmetrical in the \(y\)-axis.

  2. This is Graph D

    This is Graph D.

  3. Solve equation

    For \[ y=x-3+3x^2-x^3 \] the leading term is \(-x^3\), so it is a cubic falling to the right with two turning points.

  4. This is Graph C

    This is Graph C.

  5. Solve equation

    For \[ y=-\frac3x \] the graph is a negative reciprocal graph in quadrants 2 and 4.

  6. This is Graph B

    This is Graph B.

Final answer

D, C, B.

12. Jun 2023 P2H · Q18

Medium3 marks
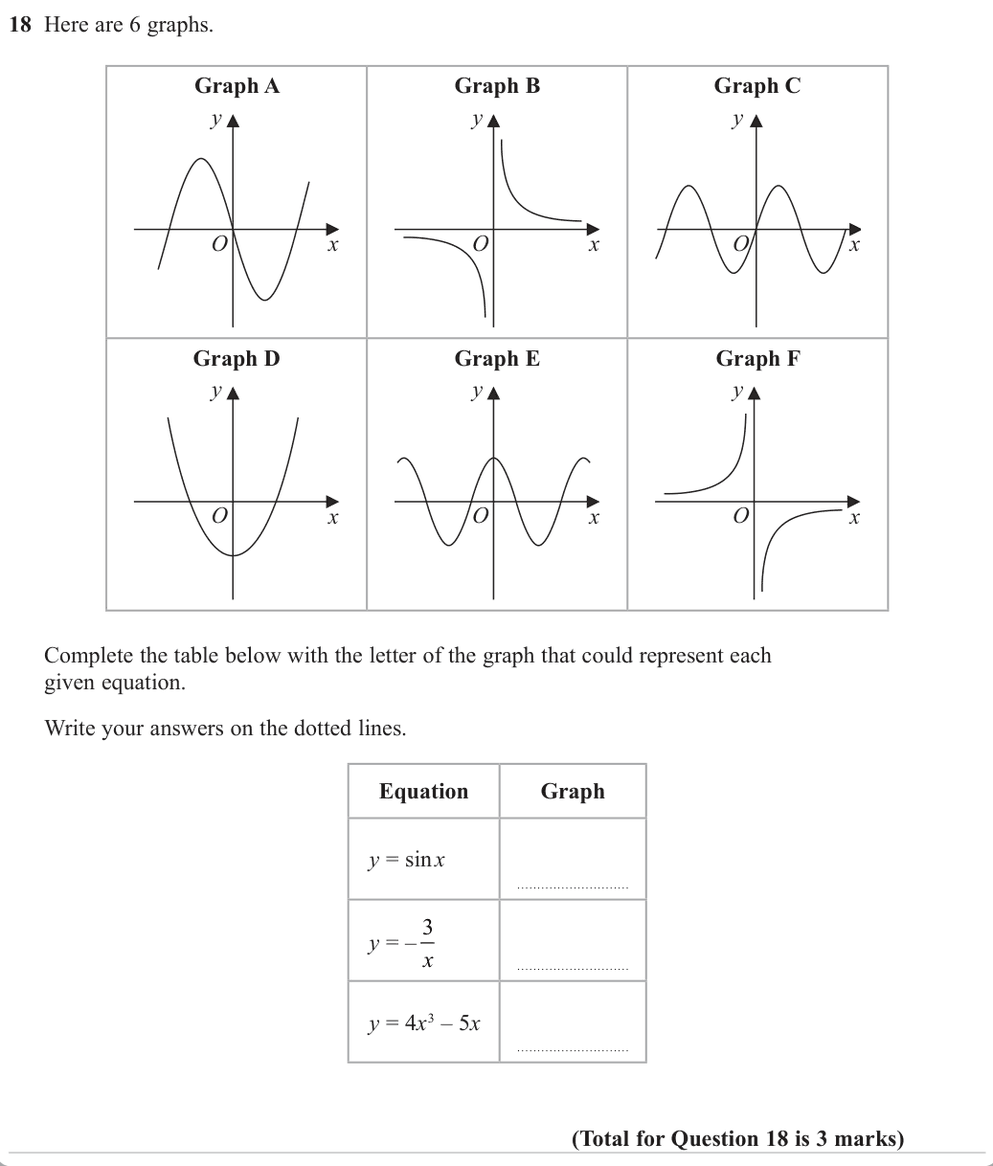
Jun 2023 P2H Question 18 (3 marks): Graphs of Functions – 18 Here are 6 graphs. Graph A y x O Graph B y x O Graph C y x O Graph D y x O Graph E y x O Graph F y x O Complete the table below with the letter of the graph that could represent each given equation. Write your answers
Show worked solution
  1. is the periodic sine shaped

    \[ y=\sin x \] is the periodic sine-shaped graph, so it is **Graph C**.

  2. Read the graph

    \[ y=\frac{3}{x} \] is the positive reciprocal graph, so it is **Graph B**.

  3. Find turning point

    \[ y=4x^3-5x \] is a cubic graph with two turning points, so it is **Graph A**.

Final answer

\(C,\ B,\ A\).

13. Jun 2023 P2HR · Q26

Medium3 marks
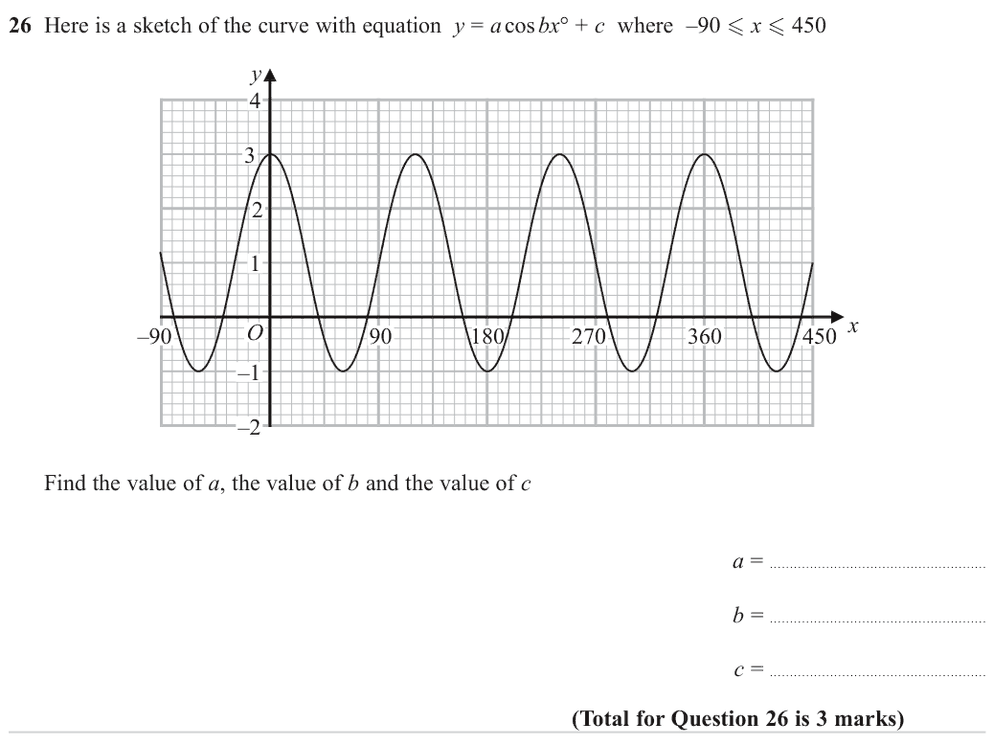
Jun 2023 P2HR Question 26 (3 marks): Graphs of Functions – 26 Here is a sketch of the curve with equation y = a cos bx° + c where -90 < x < 450 450 360 270 90 O -90 180 -2 -1 1 2 3 4 y x Find the value of a, the value of b and the value of c a =   b =   c =   (Total for Question
Show worked solution
  1. The curve is
    \[ y=a\cos bx^\circ+c \]
  2. Use trigonometry

    From the graph, the maximum value is

    \[ 3 \]
  3. Use trigonometry

    and the minimum value is

    \[ -1 \]
  4. The amplitude is half the

    The amplitude is half the difference:

    \[ a=\frac{3-(-1)}2=2 \]
  5. The midline is the average

    The midline is the average:

    \[ c=\frac{3+(-1)}2=1 \]
  6. The distance between consecutive maxima

    The distance between consecutive maxima is \(120^\circ\), so the period is

    \[ 120^\circ \]
  7. Use trigonometry

    For \(y=a\cos bx^\circ+c\), the period is

    \[ \frac{360^\circ}{b} \]
  8. Use trigonometry

    So

    \[ \frac{360}{b}=120 \]
    \[ b=3 \]
Final answer

\(\boxed{a=2,\ b=3,\ c=1}\)

14. Jun 2022 P2HR · Q16

Medium3 marks
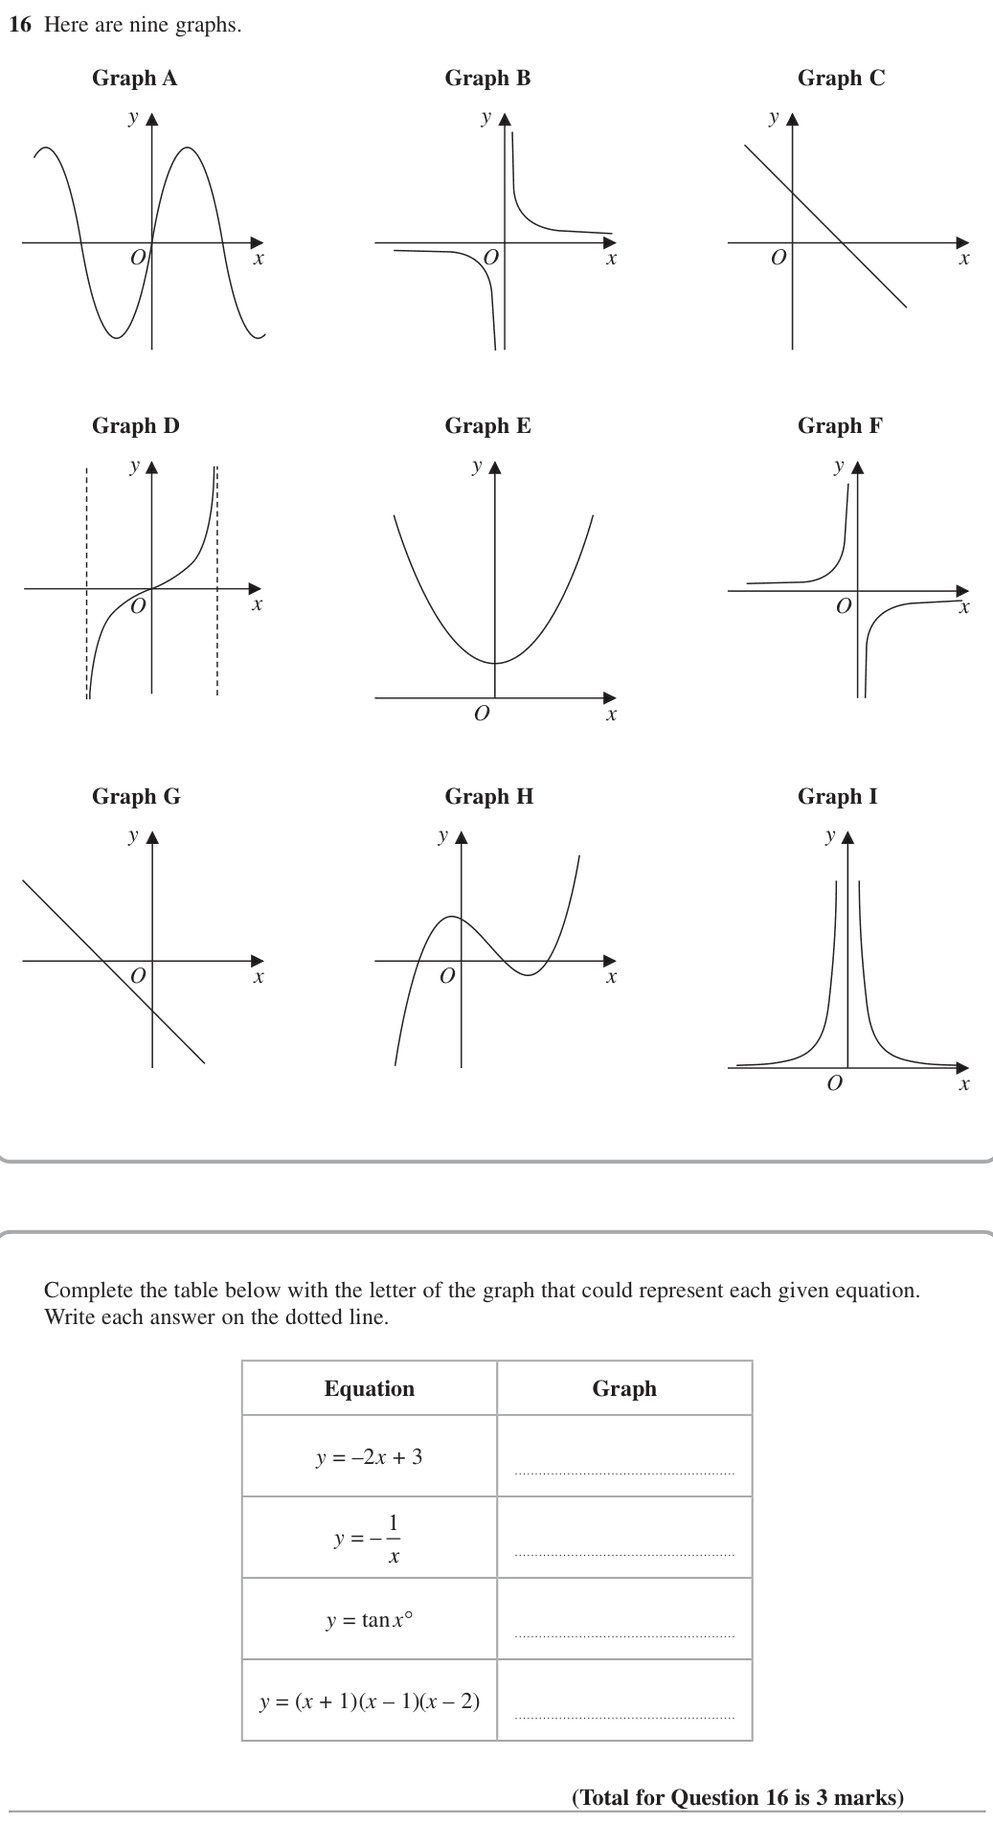
Jun 2022 P2HR Question 16 (3 marks): Graphs of Functions – 16 Here are nine graphs. y y y y y y y y y Graph A Graph D Graph G Graph B Graph E Graph H Graph C Graph F Graph I O O O O O O O O O x x x x x x x x x Complete the table below with the letter of the graph that could repr
Show worked solution
  1. is a negative straight line

    \[ y=-2x+3 \] is a negative straight line with positive \(y\)-intercept, so it is **Graph C**.

  2. Read the graph

    \[ y=\frac1x \] is the reciprocal graph in quadrants I and III, so it is **Graph B**.

  3. has repeating branches with vertical

    \[ y=\tan x \] has repeating branches with vertical asymptotes and passes through the origin, so it is **Graph D**.

  4. Read the graph

    \[ y=(x+1)(x-1)(x-2) \] is a positive cubic with three roots, so it is **Graph H**.

Final answer

C, B, D, H.

15. Jan 2022 P2HR · Q17

Medium3 marks
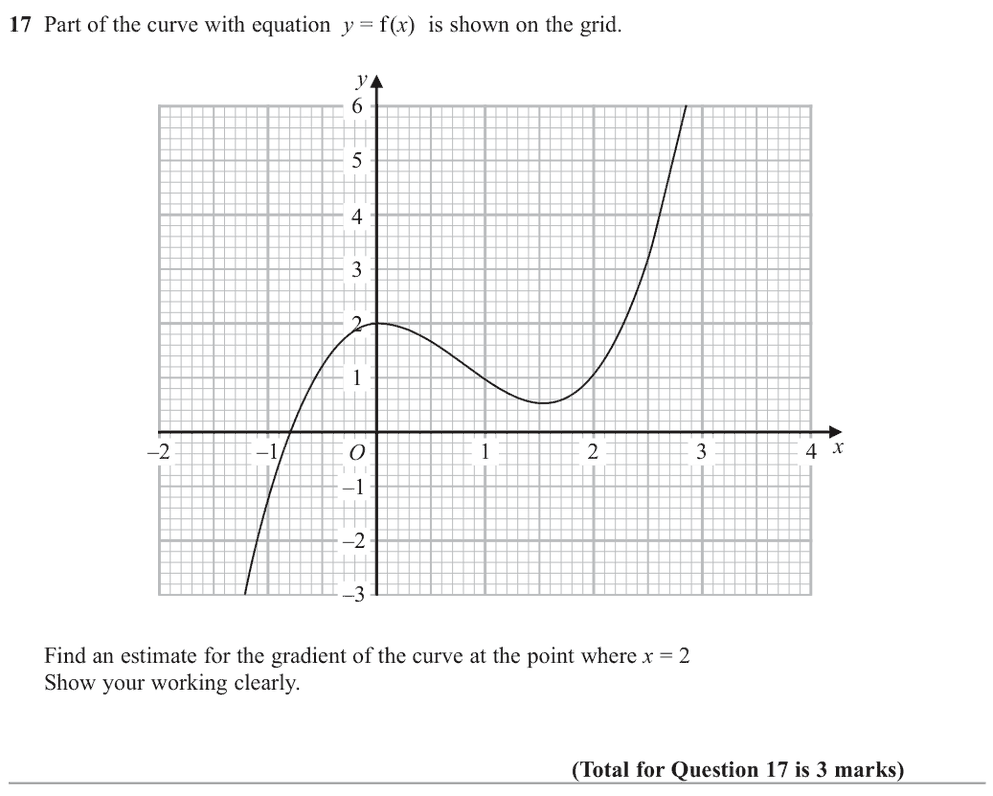
Jan 2022 P2HR Question 17 (3 marks): Graphs of Functions – 17 Part of the curve with equation y = f (x) is shown on the grid. -2 -3 -2 -1 -1 1 1 O 2 2 3 3 4 4 5 6 x y Find an estimate for the gradient of the curve at the point where x = 2 Show your working clearly.   (Total for
Show worked solution
  1. Draw a tangent to the

    Draw a tangent to the curve at the point where \[ x=2 \]

  2. Find the gradient

    Using two clear points on the tangent, for example approximately \((1.5,0.6)\) and \((2.3,2.2)\), \[ \text{gradient}\approx\frac{2.2-0.6}{2.3-1.5} \]

    \[ \text{gradient}\approx2.0 \]
Final answer

The gradient is approximately \(2\).

16. Jan 2020 P2H · Q15

Medium3 marks
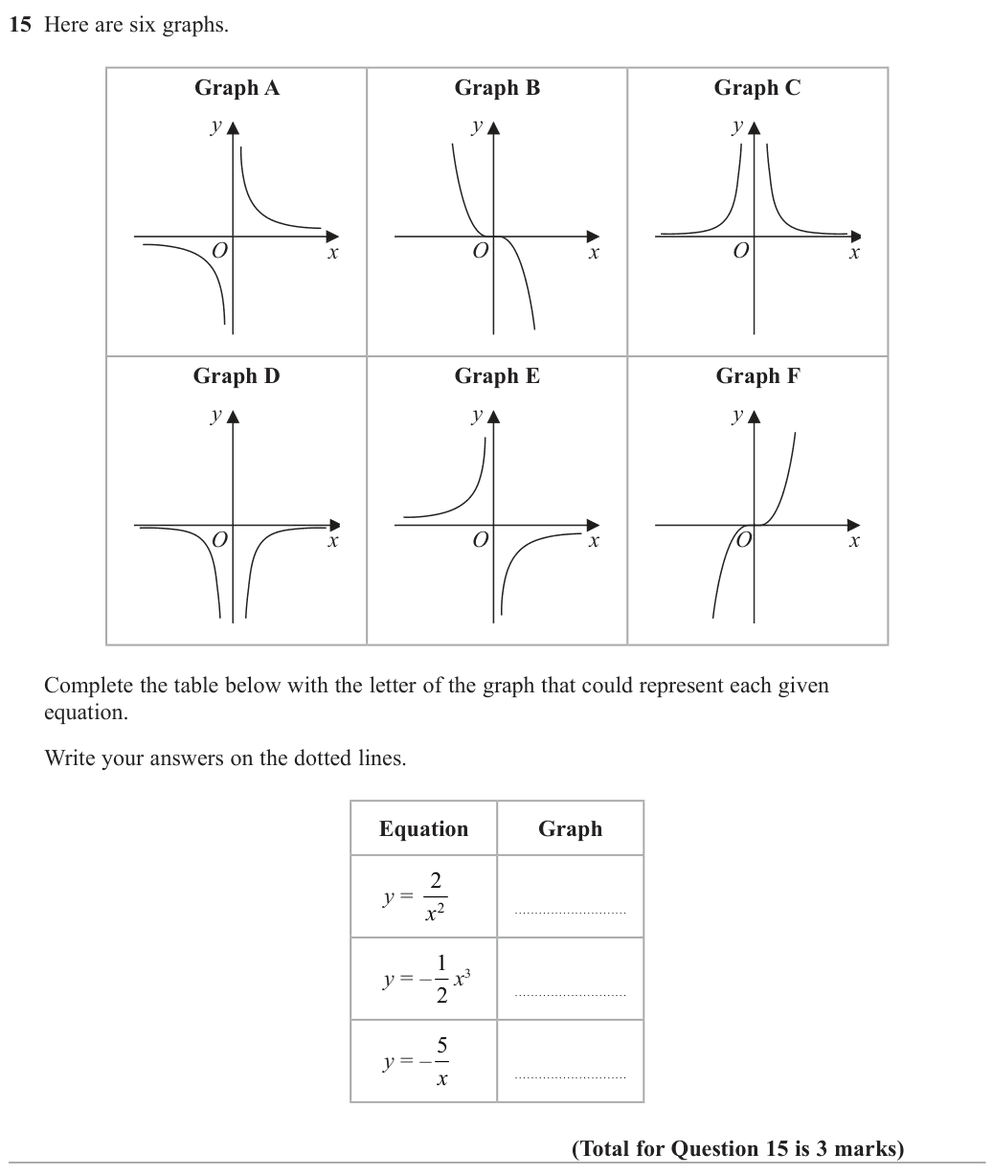
Jan 2020 P2H Question 15 (3 marks): Graphs of Functions – 15 Here are six graphs. Graph A y x O Graph B y x O Graph C y x O Graph D y x O Graph E y x O Graph F y x O Complete the table below with the letter of the graph that could represent each given equation. Write your answe
Show worked solution
  1. Solve equation

    For \[ y=-\frac{2}{x^2} \] the graph is negative on both sides of the \(y\)-axis and is symmetrical in the \(y\)-axis.

  2. This is Graph D

    This is Graph D.

  3. Solve equation

    For \[ y=-\frac12x^3 \] the graph is a decreasing cubic through the origin.

  4. This is Graph B

    This is Graph B.

  5. Solve equation

    For \[ y=\frac5x \] the graph is a positive reciprocal graph in quadrants 1 and 3.

  6. This is Graph A

    This is Graph A.

Final answer

D, B, A.

17. Jun 2026 P2HR · Q13

Medium4 marks
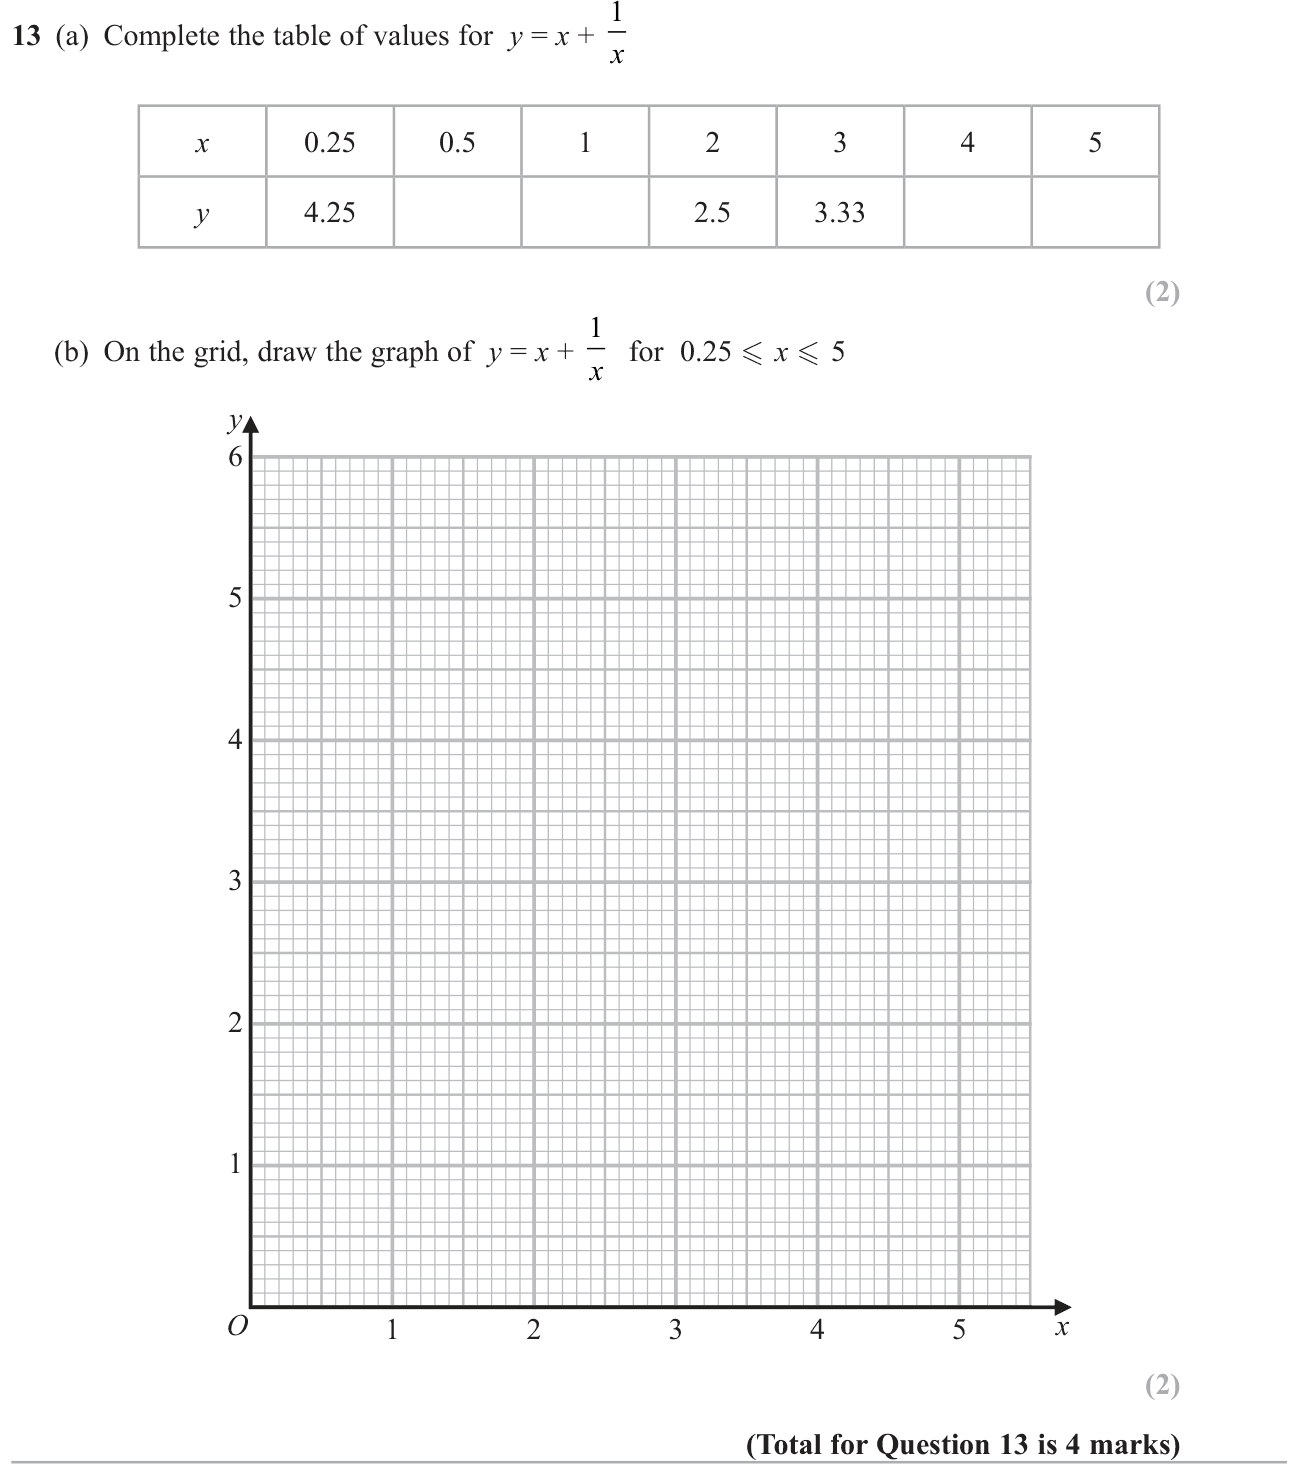
Jun 2026 P2HR Question 13 (4 marks): Graphs of Functions – 13 (a) Complete the table of values for y = x + 1 x x 0.25 0.5 1 2 3 4 5 y 4.25 2.5 3.33 (2) (b) On the grid, draw the graph of y = x + 1 x for 0.25  x  5 1 1 2 3 4 5 2 3 4 5 6 O x y (2) (Total for Question 13 is 4 mar
Show worked solution
  1. Part (a) | Step 1

    Use \(y=x+1/x\): \[y(0.5)=0.5+2=2.5,\quad y(1)=1+1=2,\quad y(4)=4+0.25=4.25,\quad y(5)=5+0.2=5.2.\]

    Substitute each required x-value into the formula.

  2. Part (b) | Step 1

    Plot \[(0.25,4.25),\ (0.5,2.5),\ (1,2),\ (2,2.5),\ (3,10/3),\ (4,4.25),\ (5,5.2).\]

    Use x horizontally and y vertically on the supplied grid; 10/3 is approximately 3.33.

  3. Part (b) | Step 2

    Join the points with one smooth curve for \(0.25\le x\le5\), descending to its minimum \((1,2)\) and then ascending.

    The graph is curved, not a set of straight segments, and includes both endpoints.

Final answer

(a) Table entries, in order: \(2.5,2,4.25,5.2\).

(b) The smooth curve \(y=x+1/x\) through the stated coordinates on \([0.25,5]\).

18. Nov 2024 P1H · Q11

Medium4 marks
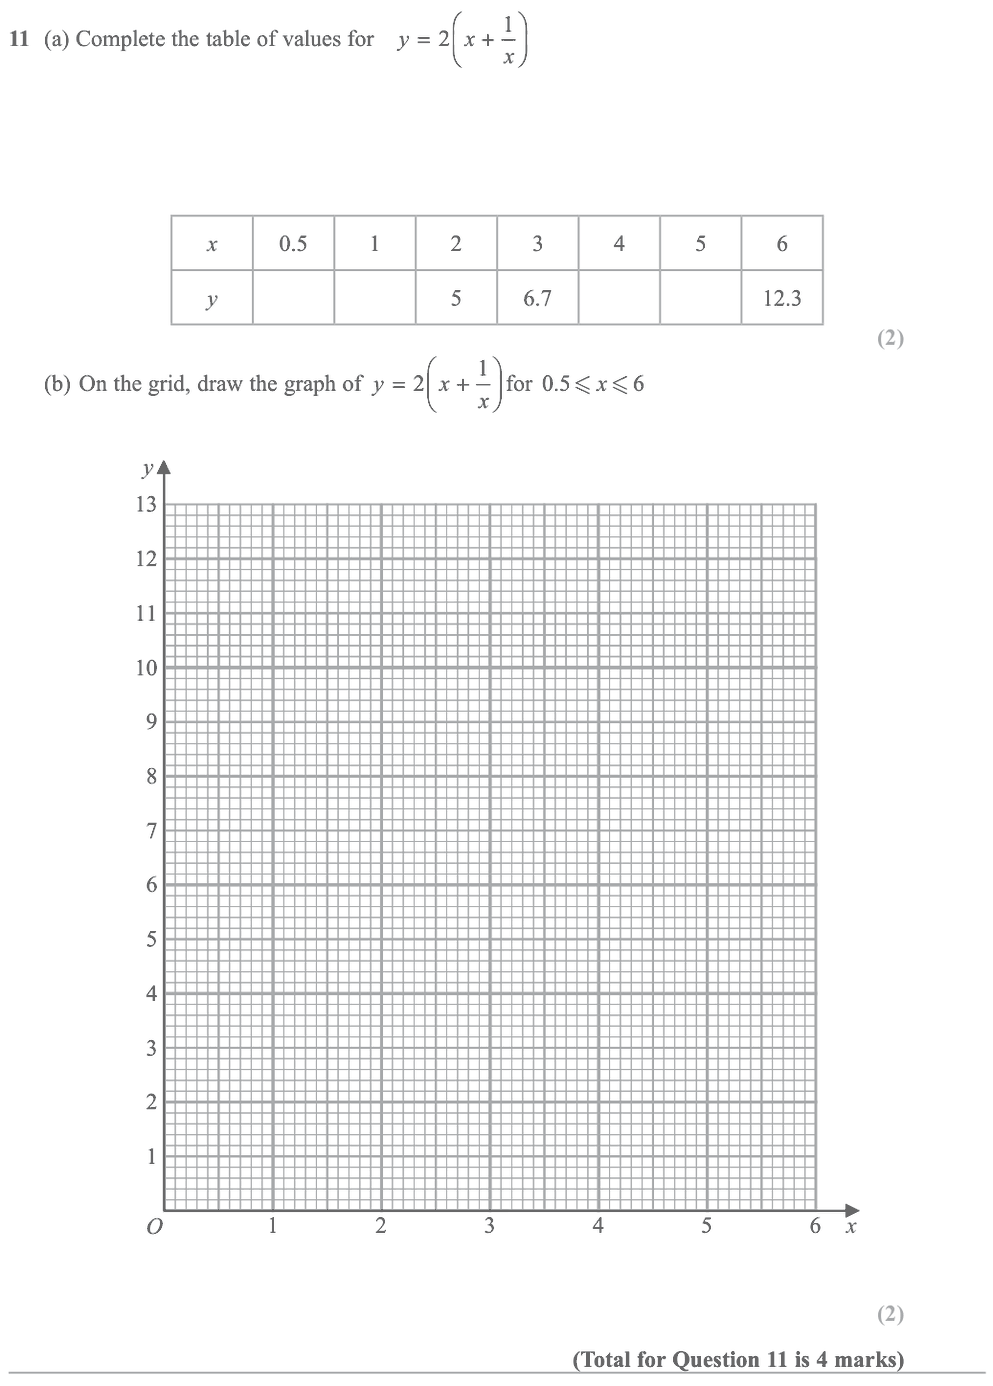
Nov 2024 P1H Question 11 (4 marks): Graphs of Functions – 11 (a) Complete the table of values for y x x    2 1 x 0.5 1 2 3 4 5 6 y 5 6.7 12.3 (2) (b) On the grid, draw the graph of y x x    2 1 for 0 5 6 . < < x 2 3 1 4 5 6 8 9 7 10 11 12 13 y 1 O 2 3 4 5 6 x (2) (Total
Show worked solution
  1. Read the graph
    \[ y=2\left(x+\frac1x\right) \]
  2. The completed table is

    The completed table is:

    \[ \begin{array}{c|rrrrrrr} x&0.5&1&2&3&4&5&6\\ \hline y&5&4&5&6.7&8.5&10.4&12.3 \end{array} \]
  3. Plot the points and join

    Plot the points and join them with a smooth curve.

Final answer

Missing values are \(5,4,8.5,10.4\).

19. Jun 2023 P2H · Q4

Medium4 marks
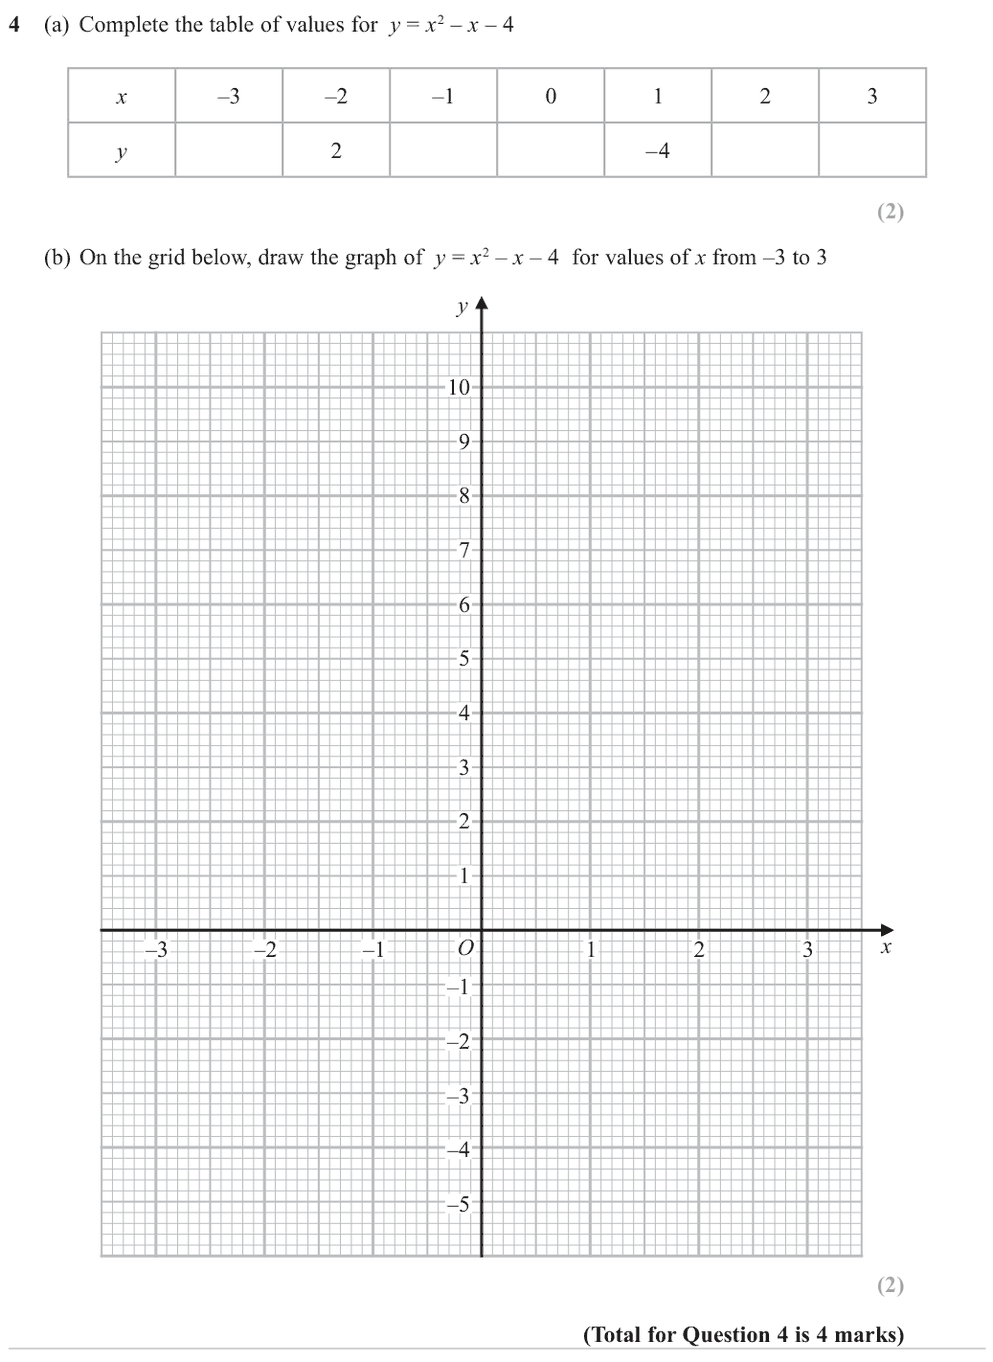
Jun 2023 P2H Question 4 (4 marks): Graphs of Functions – 4 (a) Complete the table of values for y = x2 - x - 4 x -3 -2 -1 0 1 2 3 y 2 -4 (2) (b) On the grid below, draw the graph of y = x2 - x - 4 for values of x from -3 to 3 y 10 9 8 7 6 5 4 3 2 1 O -1 -2 -3 -4 -5 x -3 -2 -1
Show worked solution
  1. Solve quadratic equation
    \[ y=x^2-x-4 \]
  2. The completed table is

    The completed table is:

    \[ \begin{array}{c|rrrrrrr} x&-3&-2&-1&0&1&2&3\\ \hline y&8&2&-2&-4&-4&-2&2 \end{array} \]
  3. Plot the points and join

    Plot the points and join them with a smooth U-shaped curve.

Final answer

Missing values are \(8,-2,-4,-2,2\).

20. Jan 2022 P1HR · Q4

Medium4 marks
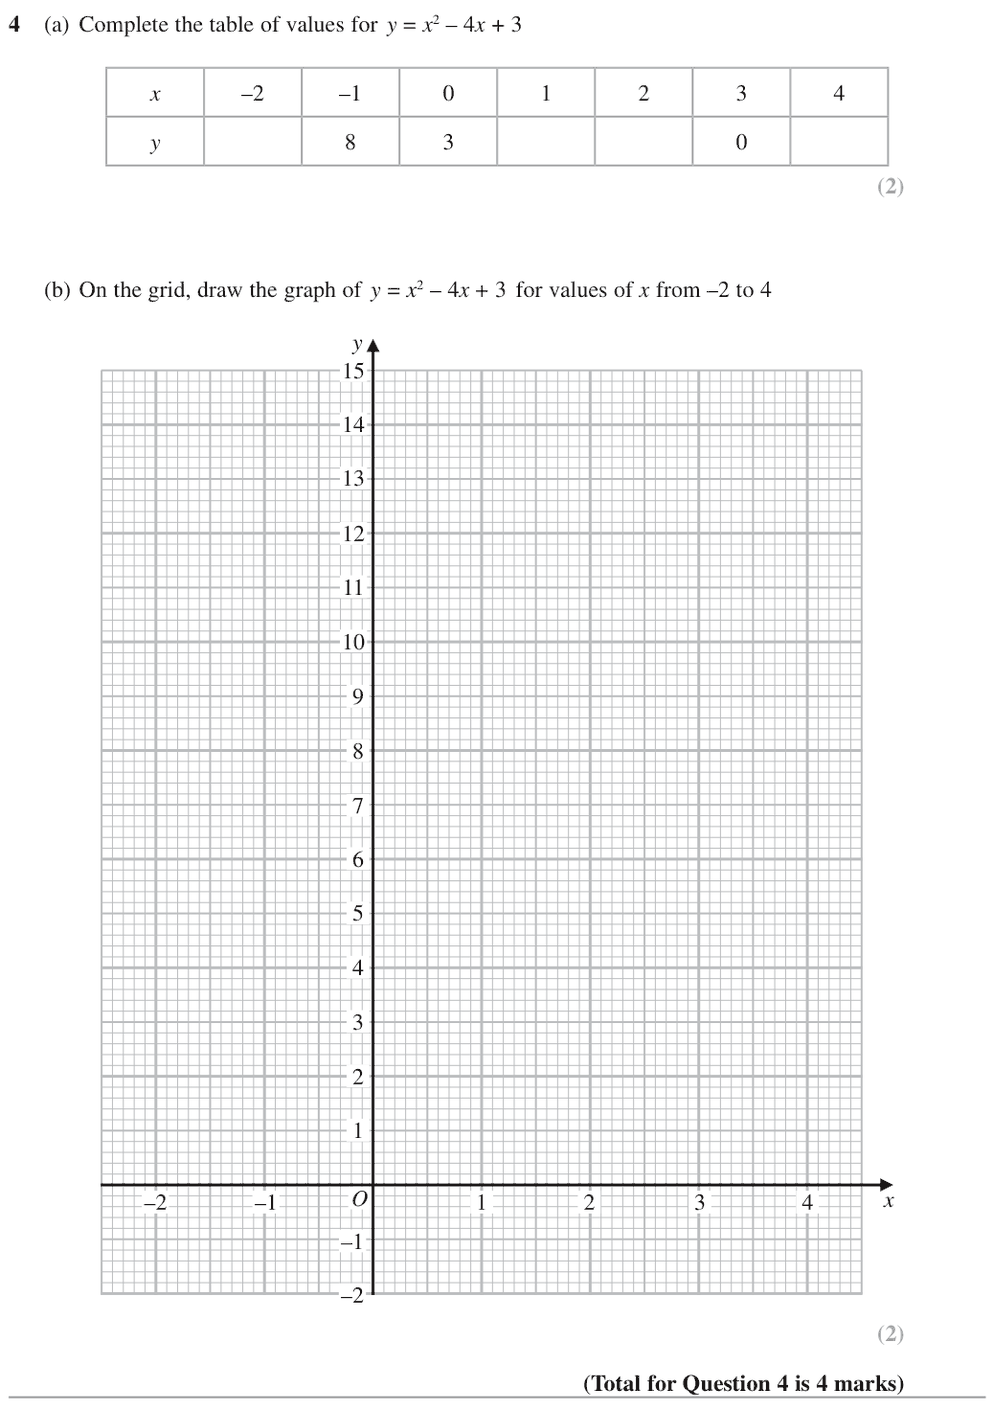
Jan 2022 P1HR Question 4 (4 marks): Graphs of Functions – 4 (a) Complete the table of values for y = x2 - 4x + 3 x -2 -1 0 1 2 3 4 y 8 3 0 (2) (b) On the grid, draw the graph of y = x2 - 4x + 3 for values of x from -2 to 4 -2 -2 -1 -1 1 x y 6 5 4 3 2 1 7 8 9 10 11 12 13 14 15 O
Show worked solution
  1. Solve quadratic equation
    \[ y=x^2-4x+3 \]
  2. The completed table is

    The completed table is:

    \[ \begin{array}{c|rrrrrrr} x&-2&-1&0&1&2&3&4\\ \hline y&15&8&3&0&-1&0&3 \end{array} \]
  3. Plot the points and join

    Plot the points and join them with a smooth U-shaped curve.

Final answer

Missing values are \(15,0,-1,3\).

21. Jan 2022 P2HR · Q11

Medium4 marks
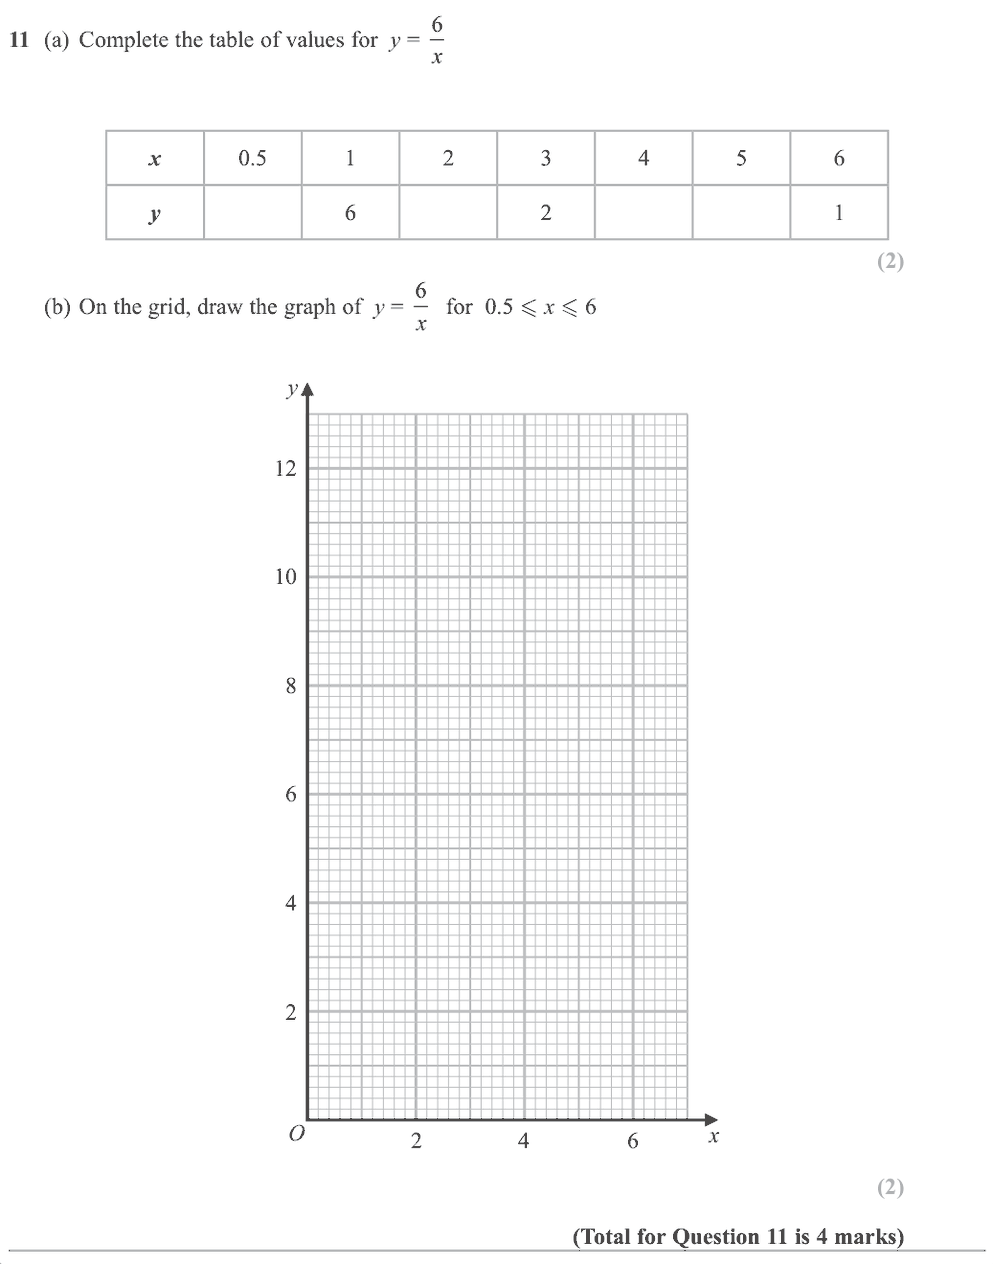
Jan 2022 P2HR Question 11 (4 marks): Graphs of Functions – 11 (a) Complete the table of values for y = 6 x x 0.5 1 2 3 4 5 6 y 6 2 1 (2) (b) On the grid, draw the graph of y = 6 x for 0.5 < x < 6 O 2 4 6 12 10 8 6 4 2 x y (2) (Total for Question 11 is 4 marks)
Show worked solution
  1. Read the graph
    \[ y=\frac6x \]
  2. The completed table is

    The completed table is:

    \[ \begin{array}{c|rrrrrrr} x&0.5&1&2&3&4&5&6\\ \hline y&12&6&3&2&1.5&1.2&1 \end{array} \]
  3. Plot the points and join

    Plot the points and join them with a smooth decreasing reciprocal curve.

Final answer

Missing values are \(12,3,1.5,1.2\).

22. May 2021 P2H · Q15

Medium4 marks
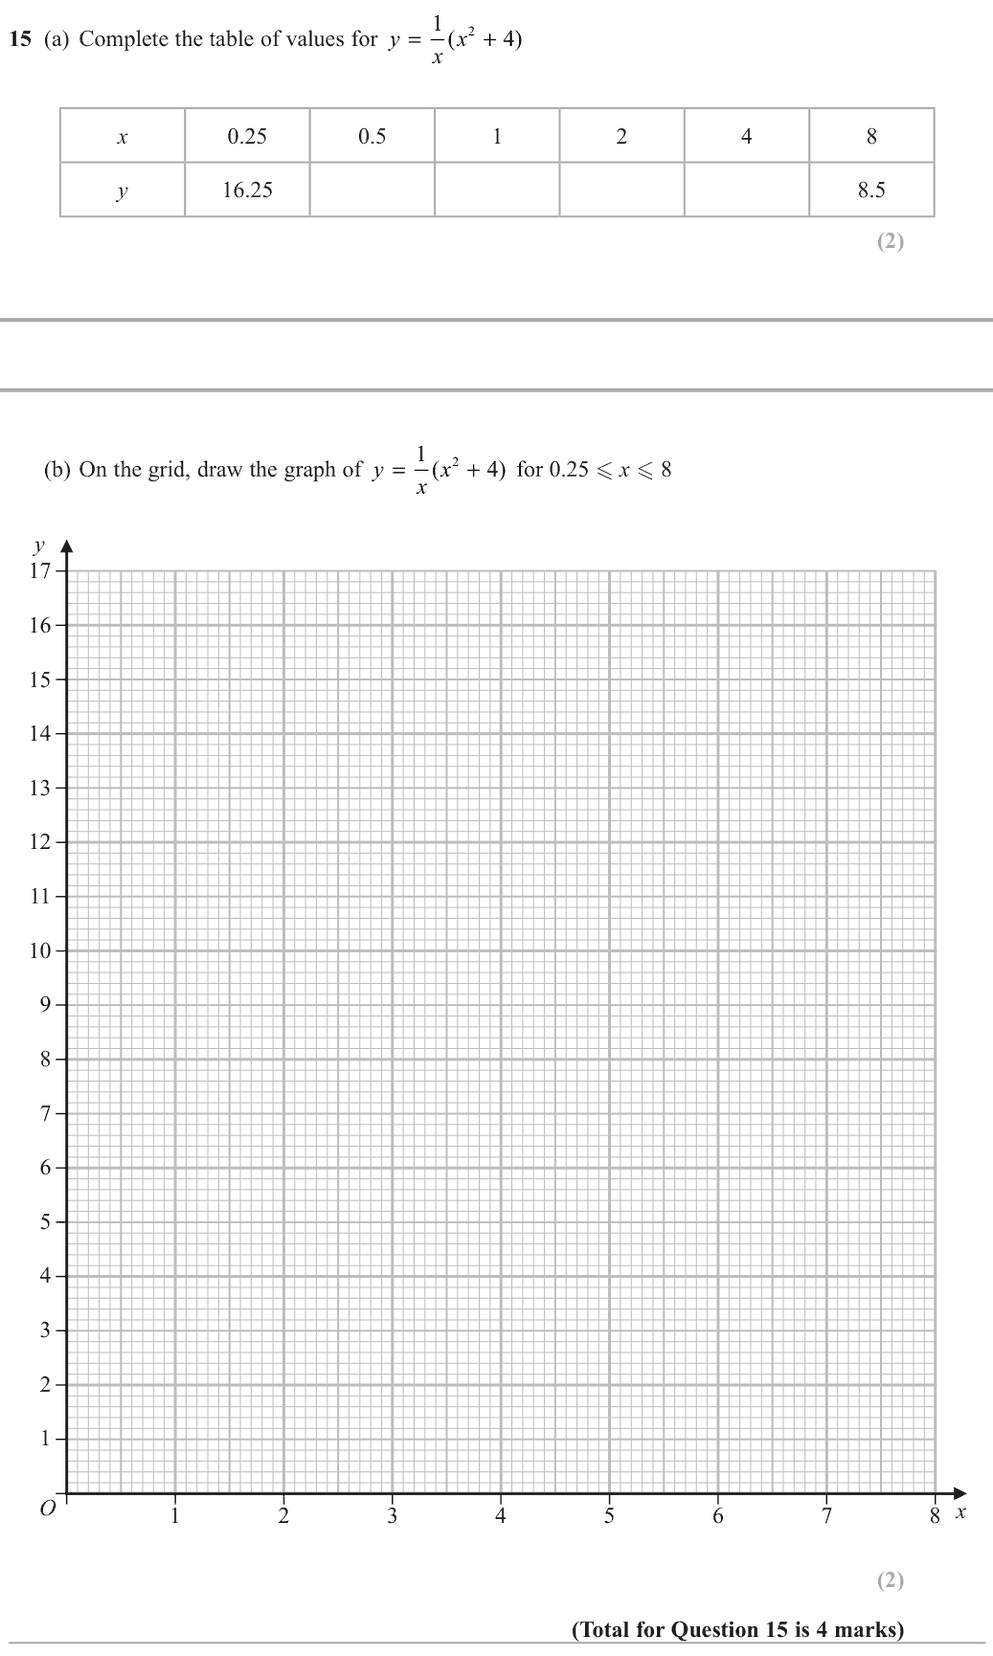
May 2021 P2H Question 15 (4 marks): Graphs of Functions – 15 (a) Complete the table of values for y x x = + 1 4 2 ( ) x 0.25 0.5 1 2 4 8 y 16.25 8.5 (2) (b) On the grid, draw the graph of y x x = + 1 4 2 ( ) for 0.25 < x < 8 17 16 15 14 13 12 11 10 9 8 7 6 5 4 3 2 1 O 1 2 3 4 5
Show worked solution
  1. Read the graph
    \[ y=\frac1x(x^2+4)=x+\frac4x \]
  2. The completed table is

    The completed table is:

    \[ \begin{array}{c|rrrrrr} x&0.25&0.5&1&2&4&8\\ \hline y&16.25&8.5&5&4&5&8.5 \end{array} \]
  3. Plot the points and join

    Plot the points and join them with a smooth curve.

Final answer

Missing values are \(8.5,5,4,5\).

23. Jan 2020 P2HR · Q15

Medium4 marks
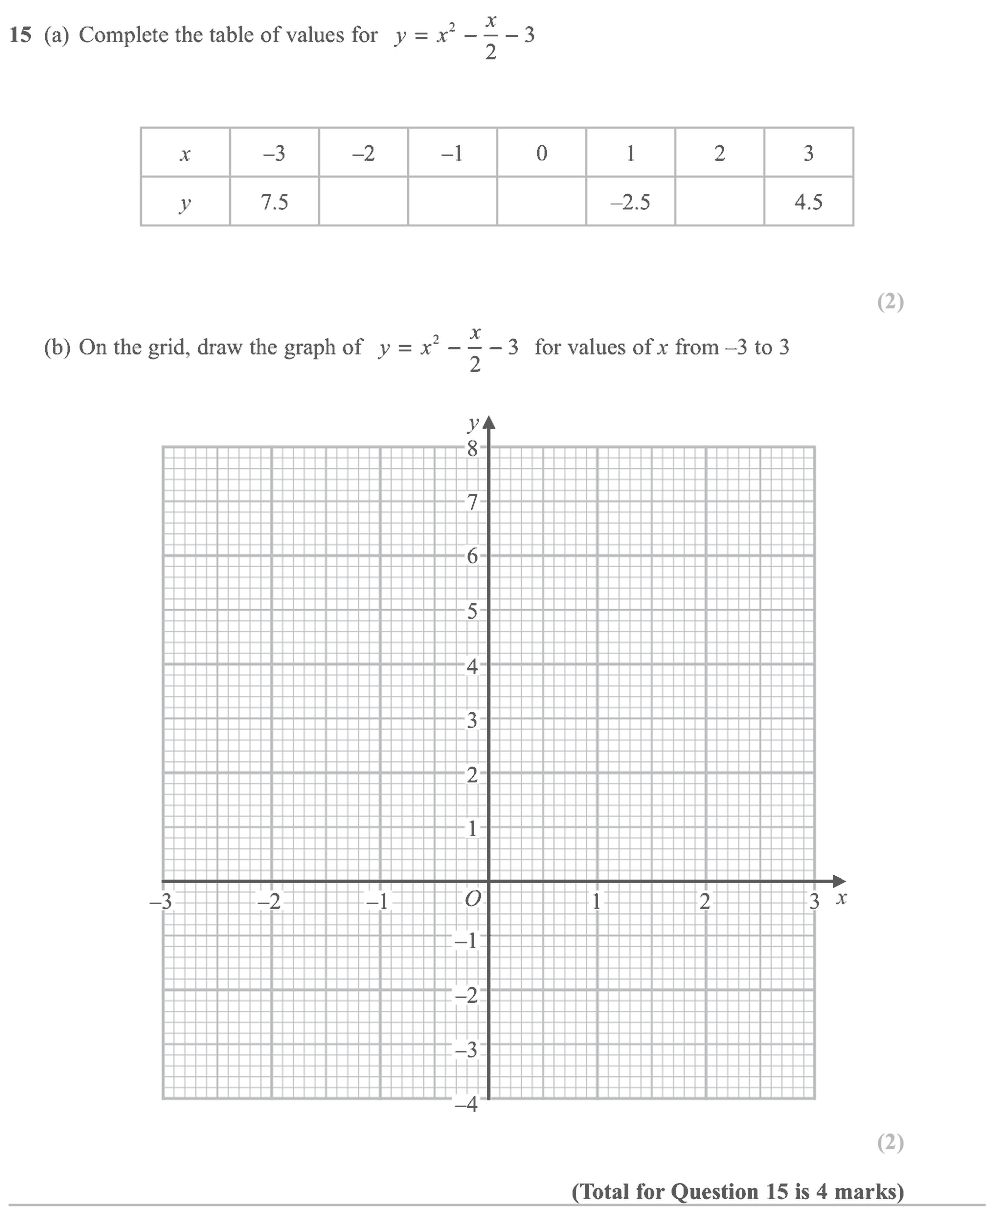
Jan 2020 P2HR Question 15 (4 marks): Graphs of Functions – 15 (a) Complete the table of values for y x x = - - 2 2 3 x -3 -2 -1 0 1 2 3 y 7.5 -2.5 4.5 (2) (b) On the grid, draw the graph of y x x = - - 2 2 3 for values of x from -3 to 3 -1 -2 O -1 -2 -3 -4 1 2 4 3 2 1 y x 3 -3 5
Show worked solution
  1. Solve quadratic equation
    \[ y=x^2-\frac{x}{2}-3 \]
  2. The completed table is

    The completed table is:

    \[ \begin{array}{c|rrrrrrr} x&-3&-2&-1&0&1&2&3\\ \hline y&7.5&2&-1.5&-3&-2.5&0&4.5 \end{array} \]
  3. Plot these points and join

    Plot these points and join them with a smooth U-shaped curve.

Final answer

Missing values are \(2,-1.5,-3,0\).

24. Jan 2020 P1H · Q20

Medium4 marks
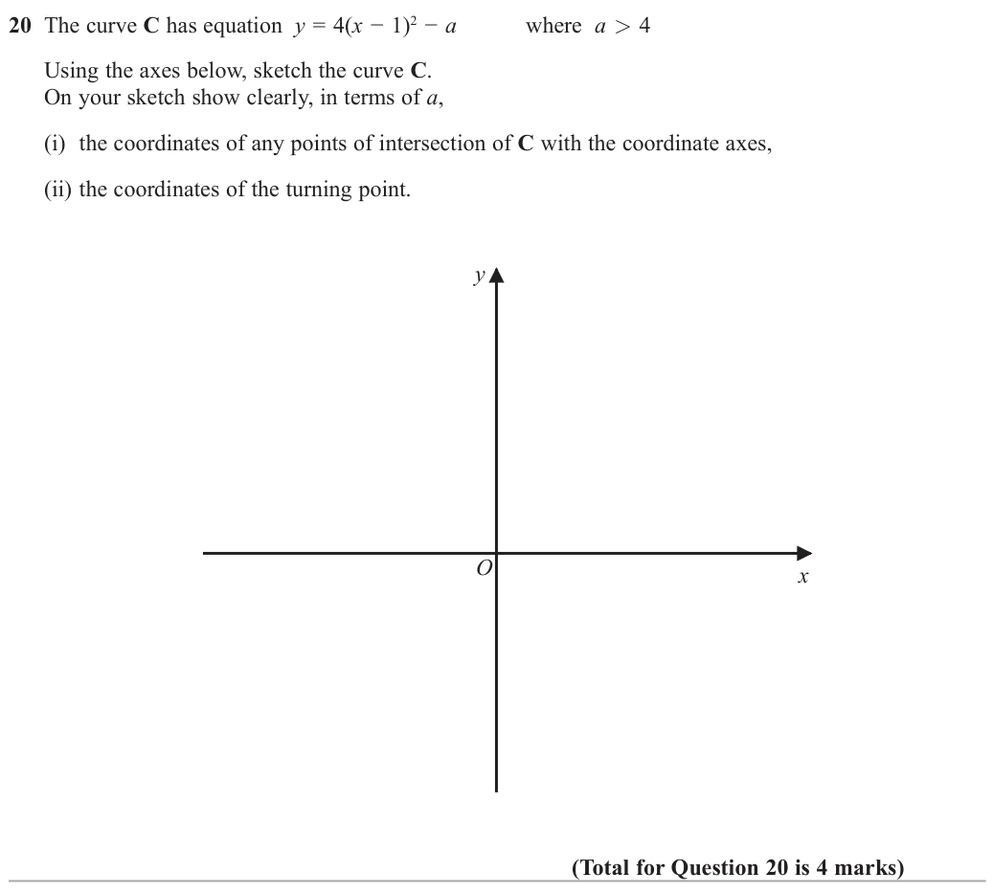
Jan 2020 P1H Question 20 (4 marks): Graphs of Functions – 20 The curve C has equation y = 4(x - 1)2 - a where a > 4 Using the axes below, sketch the curve C. On your sketch show clearly, in terms of a, (i) the coordinates of any points of intersection of C with the coordinate a
Show worked solution
  1. Calculate value
    \[ y=4(x-1)^2-a \]
  2. The turning point is read

    The turning point is read directly from the completed square form:

    \[ (1,-a) \]
  3. Find intercepts

    For the \(y\)-intercept, put \(x=0\):

    \[ y=4(0-1)^2-a \]
    \[ y=4-a \]
  4. Find intercepts

    So the \(y\)-intercept is

    \[ (0,4-a) \]
  5. Find intercepts

    For the \(x\)-intercepts, put \(y=0\):

    \[ 4(x-1)^2-a=0 \]
    \[ 4(x-1)^2=a \]
    \[ (x-1)^2=\frac{a}{4} \]
    \[ x-1=\pm \frac{\sqrt a}{2} \]
    \[ x=1\pm \frac{\sqrt a}{2} \]
  6. Find intercepts

    So the \(x\)-intercepts are

    \[ \left(1-\frac{\sqrt a}{2},0\right) \quad \text{and} \quad \left(1+\frac{\sqrt a}{2},0\right) \]
  7. Solve inequality

    Since \(a>4\), the turning point is below the \(x\)-axis and the curve crosses the \(x\)-axis twice.

Final answer

turning point \((1,-a)\), \(y\)-intercept \((0,4-a)\), \(x\)-intercepts \(\left(1-\frac{\sqrt a}{2},0\right)\) and \(\left(1+\frac{\sqrt a}{2},0\right)\)

25. Jun 2026 P2H · Q21

Hard5 marks
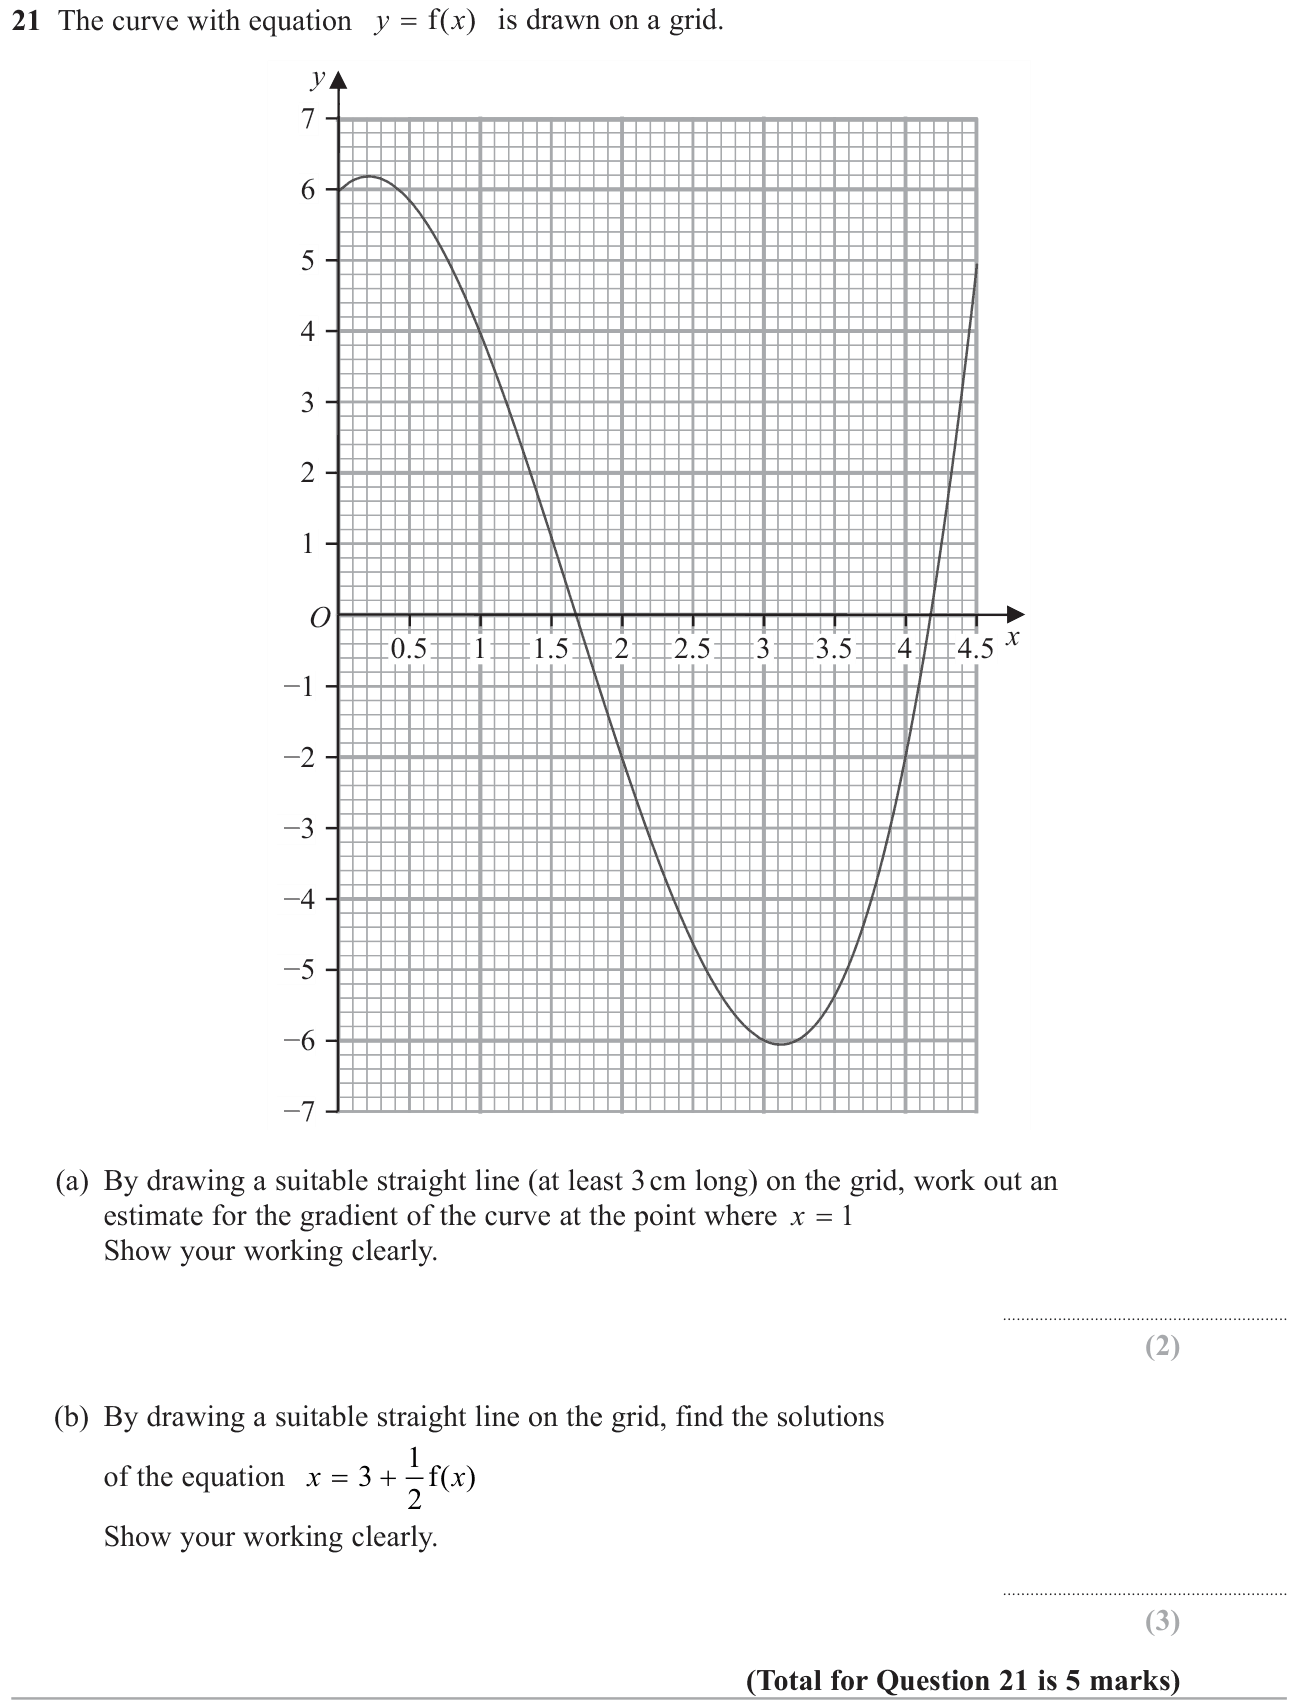
Jun 2026 P2H Question 21 (5 marks): Graphs of Functions – 21 The curve with equation y x = f( ) is drawn on a grid. 2 O 4 6 1 3 5 −7 −5 −3 −1 −6 −4 −2 1 0.5 1.5 2.5 3.5 4.5 2 3 4 7 x y (a) By drawing a suitable straight line (at least 3 cm long) on the grid, work out an estimat
Show worked solution
  1. Part (a) | Step 1

    At \(x=1\), the point is approximately \((1,4)\). Draw a tangent there, extending at least \(3\text{ cm}\). A suitable approximate tangent is \(y=-5x+9\), through \((0.5,6.5)\) and \((2,-1)\).

    The gradient at a point is estimated by the gradient of its tangent; use two well-separated points on the line.

  2. Part (a) | Step 2
    \[\text{Gradient}\approx\frac{-1-6.5}{2-0.5}=\frac{-7.5}{1.5}=-5.\]

    Calculate change in y divided by change in x using the axis values.

  3. Part (b) | Step 1
    \[x=3+\tfrac12 f(x)\quad\Rightarrow\quad f(x)=2x-6.\]

    Rearrange so the given curve y=f(x) can be intersected by a straight line.

  4. Part (b) | Step 2

    Draw \(y=2x-6\) through \((0,-6),(3,0),(4.5,3)\) on the same grid. Read the x-coordinates of its two intersections with the curve: approximately \(2.0\) and \(4.4\).

    Each intersection has equal y-values on the line and curve and therefore solves the original equation.

Final answer

(a) Gradient \(\approx-5\).

(b) \(x\approx2.0\) or \(x\approx4.4\).

26. Nov 2025 P2H · Q12

Hard5 marks
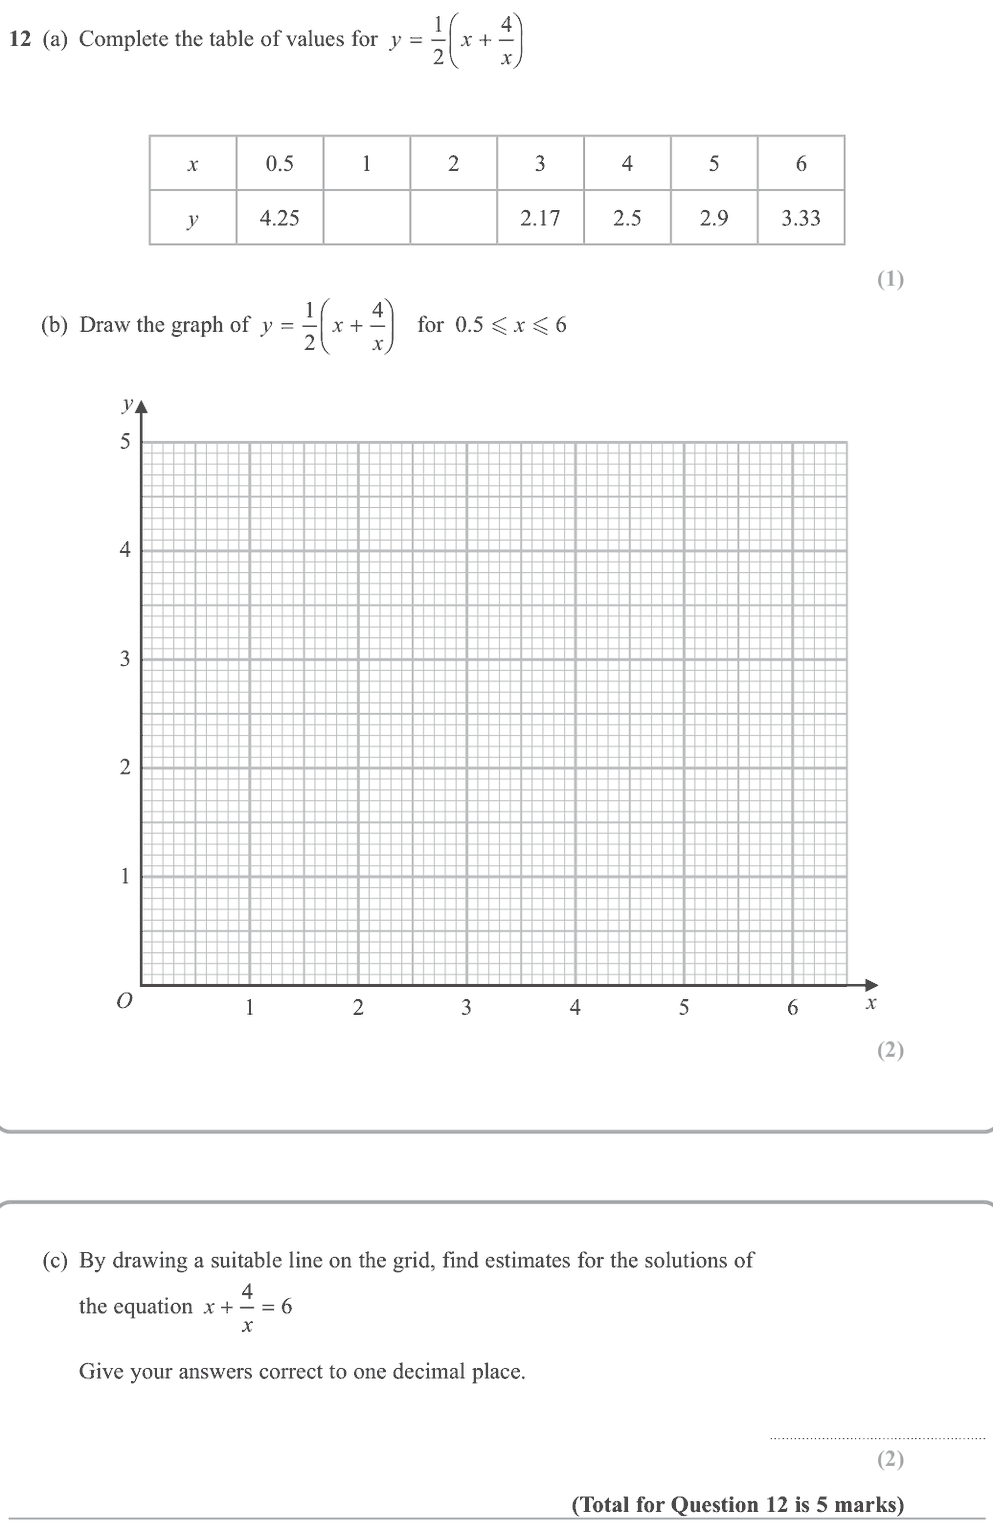
Nov 2025 P2H Question 12 (5 marks): Graphs of Functions – 12 (a) Complete the table of values for 1 4 2 y x x   = +     x 0.5 1 2 3 4 5 6 y 4.25 2.17 2.5 2.9 3.33 (1) (b) Draw the graph of 1 4 2 y x x   = +     for 0.5 < x < 6 O x y 1 2 3 4 5 1 2 3 4 5 6 (2) (c) By
Show worked solution
  1. Read the graph
    \[ y=\frac12\left(x+\frac4x\right) \]
  2. The completed table is

    The completed table is:

    \[ \begin{array}{c|rrrrrrr} x&0.5&1&2&3&4&5&6\\ \hline y&4.25&2.5&2&2.17&2.5&2.9&3.33 \end{array} \]
  3. Read the graph

    For \[ x+\frac4x=6 \] we need \[ \frac12\left(x+\frac4x\right)=3 \]

  4. Read the graph

    So draw the horizontal line \(y=3\) on the graph.

  5. The intersections give approximately
    \[ x=0.8 \quad \text{and} \quad x=5.2 \]
Final answer

Table missing values \(2.5,2\). Estimates \(0.8\) and \(5.2\).

27. Nov 2024 P1H · Q23

Hard5 marks
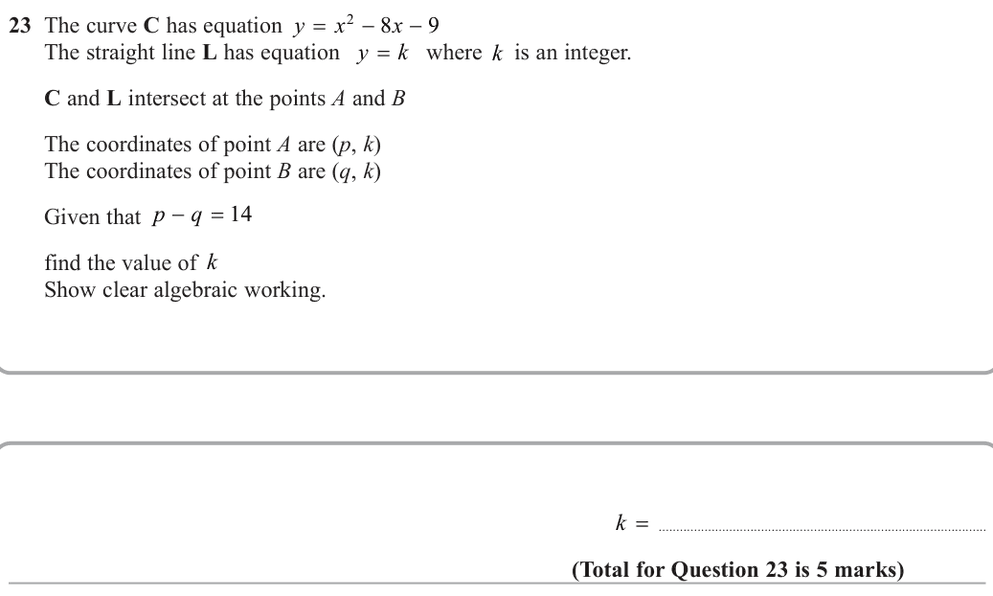
Nov 2024 P1H Question 23 (5 marks): Graphs of Functions – 23 The curve C has equation y x x 2 8 9 The straight line L has equation y k = where k is an integer. C and L intersect at the points A and B The coordinates of point A are (p, k) The coordinates of point B are (q, k) Gi
Show worked solution
  1. The curve is
    \[ y=x^2-8x-9 \]
  2. The line is
    \[ y=k \]
  3. Read the graph

    At the intersection points,

    \[ x^2-8x-9=k \]
    \[ x^2-8x-(9+k)=0 \]
  4. Read the graph

    The two roots are \(p\) and \(q\).

  5. Solve quadratic equation

    For this quadratic,

    \[ p+q=8 \]
  6. We are also given
    \[ p-q=14 \]
  7. Solve the two equations

    Solve the two equations:

    \[ 2p=22 \]
    \[ p=11 \]
    \[ q=-3 \]
  8. Read the graph

    Use one root in \(y=x^2-8x-9\):

    \[ k=11^2-8(11)-9 \]
    \[ k=121-88-9 \]
    \[ k=24 \]
Final answer

\(k=24\)

28. Nov 2023 P1H · Q12

Hard5 marks
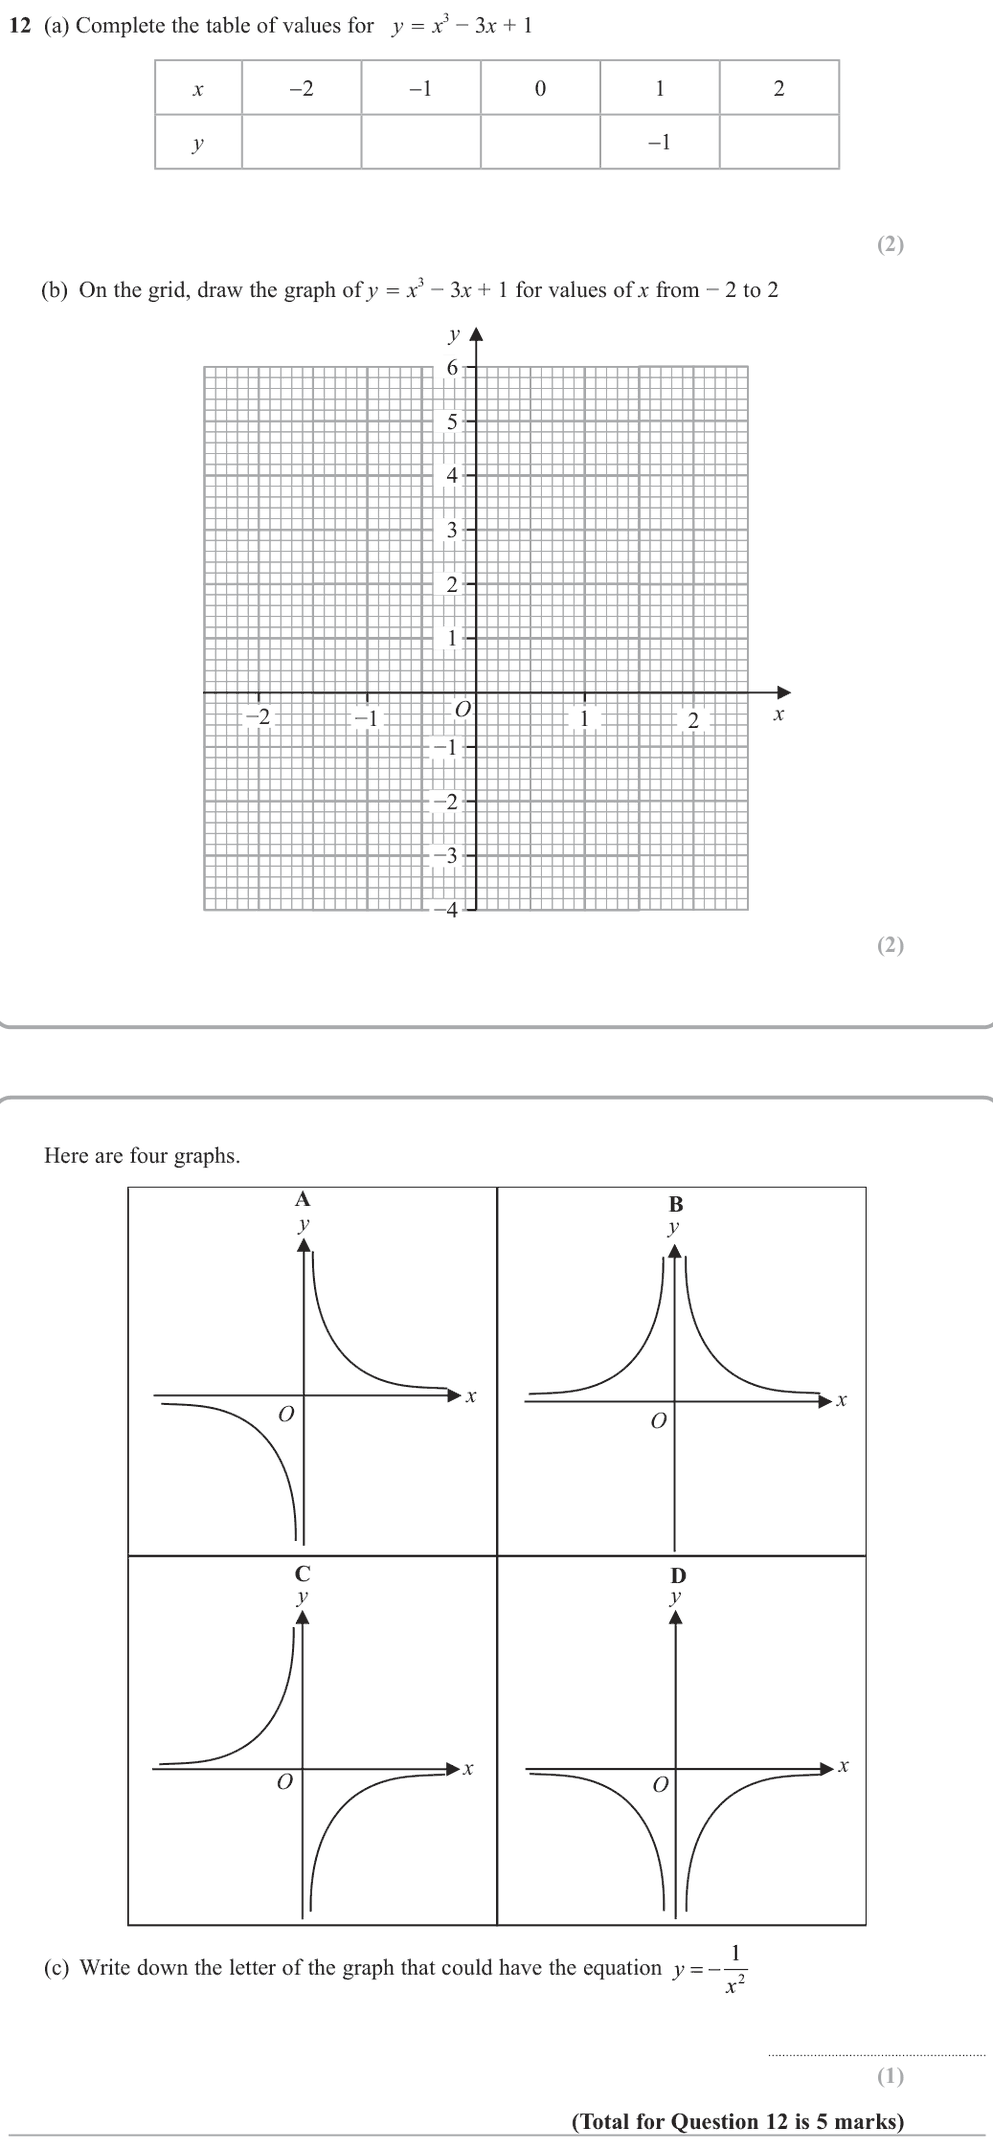
Nov 2023 P1H Question 12 (5 marks): Graphs of Functions – 12 (a) Complete the table of values for y = x3 - 3x + 1 x -2 -1 0 1 2 y -1 (2) (b) On the grid, draw the graph of y = x3 - 3x + 1 for values of x from - 2 to 2 x y O -1 1 -1 -2 -3 -4 1 2 3 4 5 6 2 -2 (2) Here are four gr
Show worked solution
  1. Read the graph
    \[ y=x^3-3x+1 \]
  2. The completed table is

    The completed table is:

    \[ \begin{array}{c|rrrrr} x&-2&-1&0&1&2\\ \hline y&-1&3&1&-1&3 \end{array} \]
  3. The graph of is below

    The graph of \[ y=-\frac1{x^2} \] is below the \(x\)-axis on both sides and is symmetrical in the \(y\)-axis.

Final answer

The graph letter is D.

29. Jan 2022 P2H · Q21

Hard5 marks
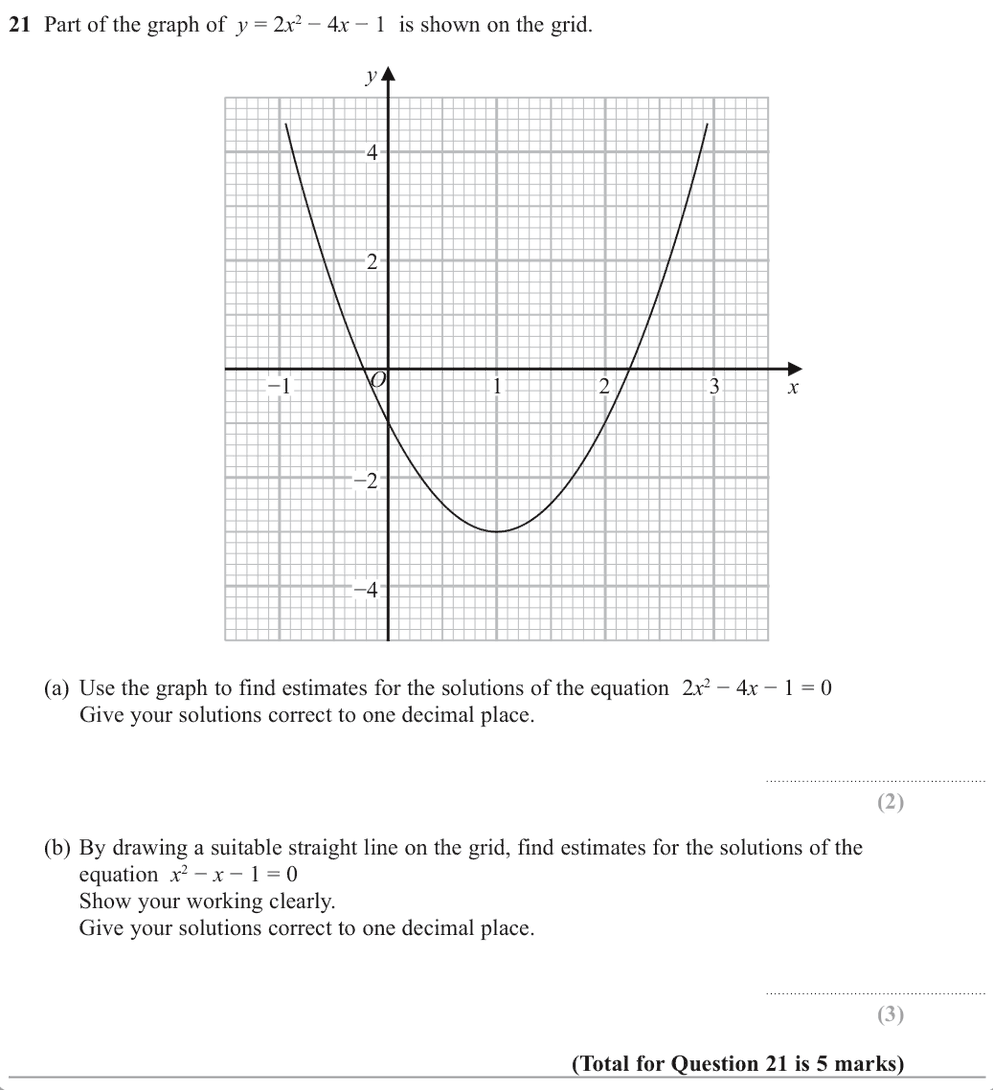
Jan 2022 P2H Question 21 (5 marks): Graphs of Functions – 21 Part of the graph of y = 2x2 - 4x - 1 is shown on the grid. -2 O 2 4 -4 -1 1 2 3 y x (a) Use the graph to find estimates for the solutions of the equation 2x2 - 4x - 1 = 0 Give your solutions correct to one decimal pl
Show worked solution
  1. Read the graph

    For part (a), solve

    \[ 2x^2-4x-1=0 \]
  2. Read the graph

    Using the graph gives approximately

    \[ x=-0.2,\quad x=2.2 \]
  3. Read the graph

    For part (b), we need to solve

    \[ x^2-x-1=0 \]
  4. Multiply by 2

    Multiply by 2:

    \[ 2x^2-2x-2=0 \]
  5. The given graph is
    \[ y=2x^2-4x-1 \]
  6. Read the graph

    Now

    \[ 2x^2-2x-2=(2x^2-4x-1)+2x-1 \]
  7. Read the graph

    So draw the straight line

    \[ y=1-2x \]
  8. The intersections of this line

    The intersections of this line with the curve give approximately

    \[ x=-0.6,\quad x=1.6 \]
Final answer

(a) \(-0.2,\ 2.2\); (b) draw \(y=1-2x\), giving \(-0.6,\ 1.6\)

30. May 2026 4WM1H · Q14

Hard6 marks
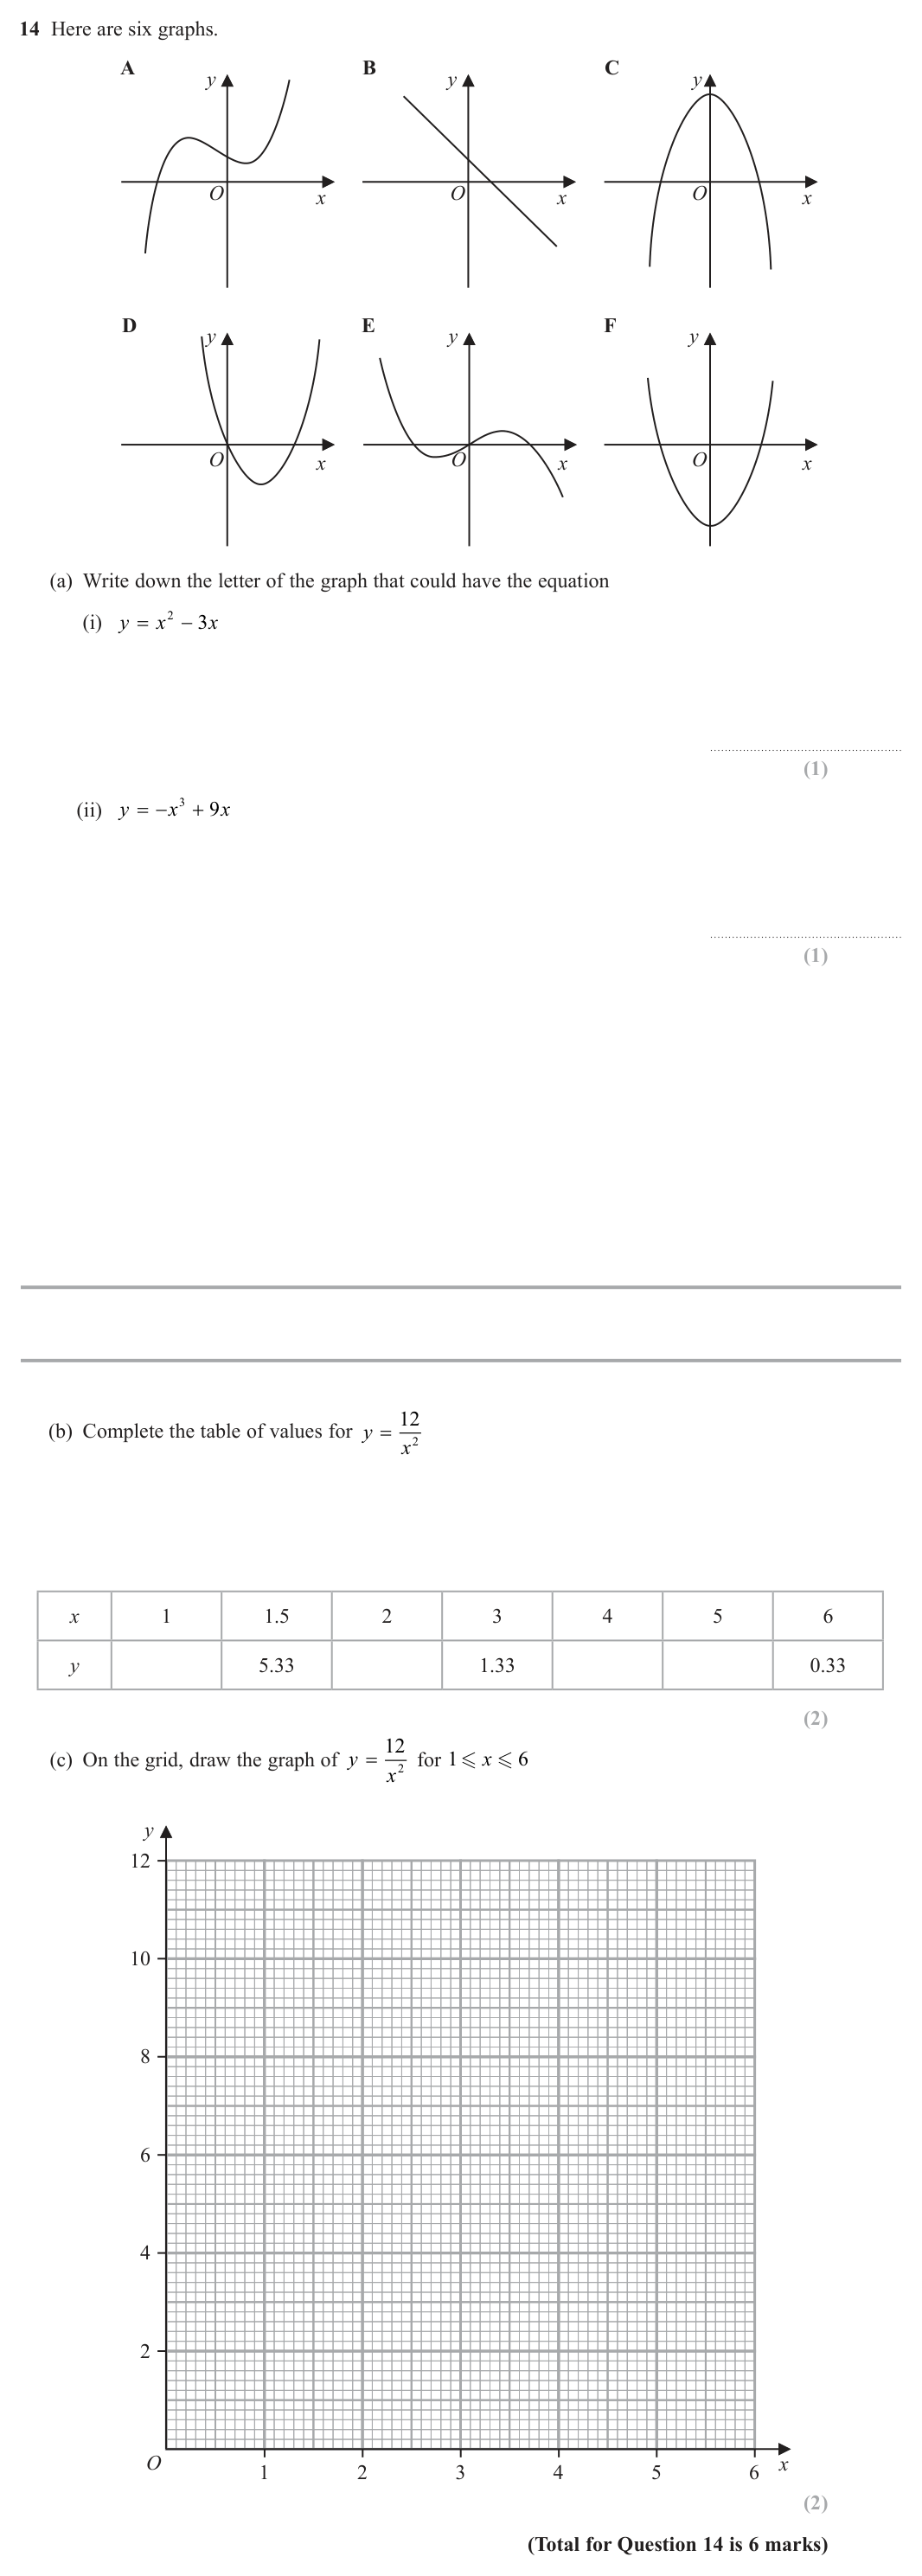
May 2026 4WM1H Question 14 (6 marks): Graphs of Functions – 14 Here are six graphs. O y x C B O y x A y x O E O y x D O y x O y x F (a) Write down the letter of the graph that could have the equation (i) y x x 2 3   (1) (ii) y x x 3 9   (1) (b) Complete the table of values for y
Show worked solution
  1. (a)(i) Positive quadratic

    \(y=x^2-3x=x(x-3)\): U-shape through \(O\) and \(x=3\) → graph D.

  2. (a)(ii) Negative cubic

    \(y=-x^3+9x\): negative cubic through the origin → graph E.

  3. (b) Substitute
    \[x=1:\ 12,\quad x=2:\ 3,\quad x=4:\ 0.75,\quad x=5:\ 0.48\]
  4. (c) Plot and join with a smooth curve

    Plot all 7 points and draw a smooth curve (no straight segments).

Final answer

(a)(i) D (ii) E (b) \(12,\ 3,\ 0.75,\ 0.48\) (c) smooth curve through the points

31. Jan 2020 P1HR · Q18

Hard7 marks
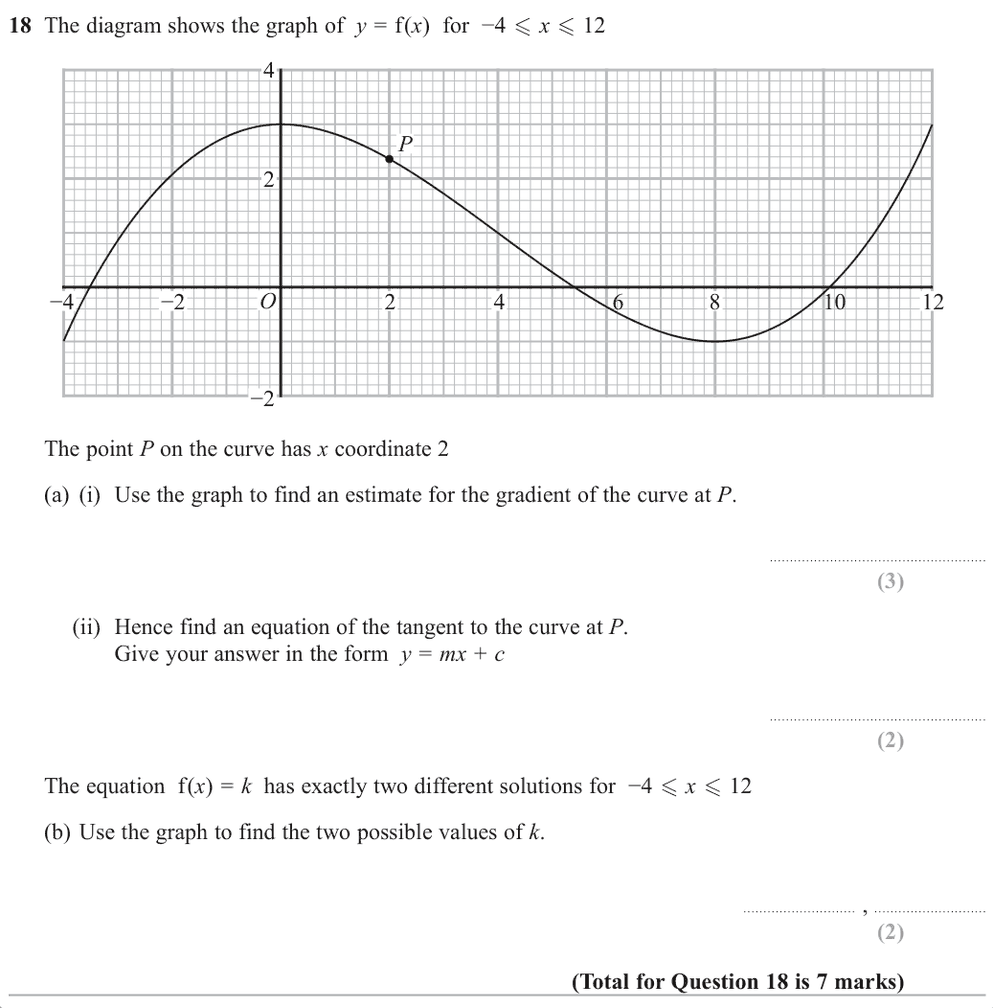
Jan 2020 P1HR Question 18 (7 marks): Graphs of Functions – 18 The diagram shows the graph of y = f (x) for -4 < x < 12 P -4 -2 O 2 4 6 8 10 12 2 4 -2 The point P on the curve has x coordinate 2 (a) (i) Use the graph to find an estimate for the gradient of the curve at P.   (3) (
Show worked solution
  1. Draw a tangent to the

    Draw a tangent to the curve at \(P\).

  2. A reasonable tangent gives an

    A reasonable tangent gives an estimated gradient of about \[ m\approx -0.6 \]

  3. The point is approximately

    The point \(P\) is approximately \[ (2,2.4) \]

  4. Find the gradient

    Using \(y=mx+c\), \[ 2.4\approx -0.6(2)+c \]

    \[ c\approx3.6 \]
  5. Find the gradient

    So an approximate tangent equation is \[ y\approx -0.6x+3.6 \]

  6. The equation has exactly two

    The equation \(f(x)=k\) has exactly two different solutions when the horizontal line touches one turning level.

  7. Find the gradient

    From the graph, these levels are approximately \[ k=3 \quad \text{and} \quad k=-1 \]

Final answer

Gradient \(\approx -0.6\), tangent \(y\approx -0.6x+3.6\), and \(k\approx3,-1\).

More IGCSE Maths 4MA1 topics

Dr Eslam Ahmed
Dr Eslam Ahmed

Elite Mathematics · Questions classified by topic, solutions checked by Dr Eslam