Kinematics Graphs: past paper questions & worked solutions
Every Kinematics Graphs question from the WME01 papers in our bank, 2019–2026, sorted from easiest to hardest. Try each one first, then open the worked solution.
Medium8 marks · main topic: Constant Acceleration in 1DShow worked solution
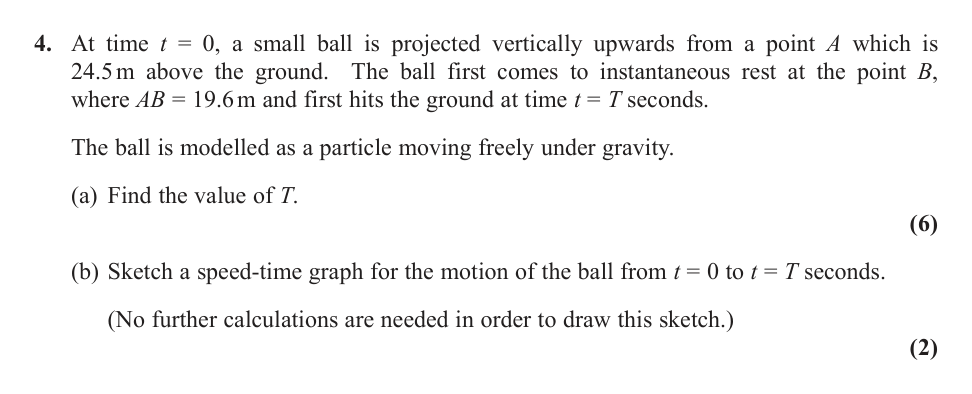
Find the initial speed
At the highest point B, the velocity is $0$ and $AB=19.6$ m. Use $v^2=u^2+2as$ upward: $0=u^2-2g(19.6)$.
Calculate u
$u^2=2(9.8)(19.6)=384.16$, so $u=19.6\ \mathrm{m\,s^{-1}}$.
Use displacement to the ground
From A to the ground, taking upward as positive, displacement is $-24.5$ m. Use $s=ut+\dfrac12at^2$: $-24.5=19.6T-4.9T^2$.
Solve for T
$4.9T^2-19.6T-24.5=0$. Divide by $4.9$: $T^2-4T-5=0$, so $(T-5)(T+1)=0$. The positive time is $T=5$ s.
Describe the speed-time graph
The speed starts at $19.6$, decreases linearly to $0$ at $t=2$, then increases linearly until the ball hits the ground at $t=5$. The final speed is $29.4$, so the second line is longer than the first.
Final answer
$(a)\ T=5\ \mathrm{s}.\quad (b)$ Speed-time graph is V-shaped, from speed $19.6$ at $t=0$ to $0$ at $t=2$, then to speed $29.4$ at $t=5$.
3. WME01/01 October 2022 · Q5
Hard9 marks · main topic: Constant Acceleration in 1DShow worked solution
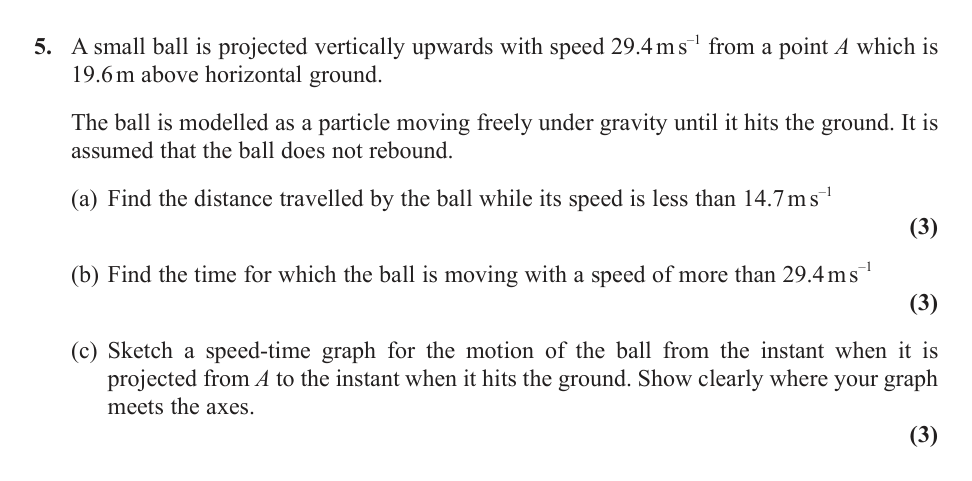
Find one side of the slow-speed interval
The speed is less than $14.7\ \mathrm{m\,s^{-1}}$ near the highest point. From speed $14.7$ to speed $0$, use $v^2=u^2+2as$: $0=14.7^2-2gs$.
Find the total distance
This gives $s=11.025$ m on the way up. The same distance occurs on the way down before the speed reaches $14.7$ again, so the total distance is $2s=22.05\ \mathrm{m}$, about $22.1\ \mathrm{m}$.
Interpret speed greater than 29.4
The ball has speed $29.4$ again when it passes A on the way down. It is faster than $29.4$ only after passing A downward until it hits the ground.
Find that time
From A to the ground, taking downward as positive, $19.6=29.4t+\dfrac12gt^2$.
Solve the time equation
$19.6=29.4t+4.9t^2$, giving the positive root $t=0.606\ldots\ \mathrm{s}$.
Describe the speed-time graph
The graph starts at speed $29.4$ when $t=0$, decreases linearly to speed $0$ at $t=3$, then increases linearly until the ball hits the ground. The final speed is greater than $29.4$, so the right-hand arm ends above the starting height on the speed axis.
Final answer
$(a)\ 22.1\ \mathrm{m}\ \text{approximately}.\quad (b)\ 0.606\ \mathrm{s}\ \text{approximately}.\quad (c)$ V-shaped speed-time graph through $(0,29.4)$ and $(3,0)$, ending above $29.4$.
4. WME01/01 January 2026 · Q2
Hard10 marksShow worked solution
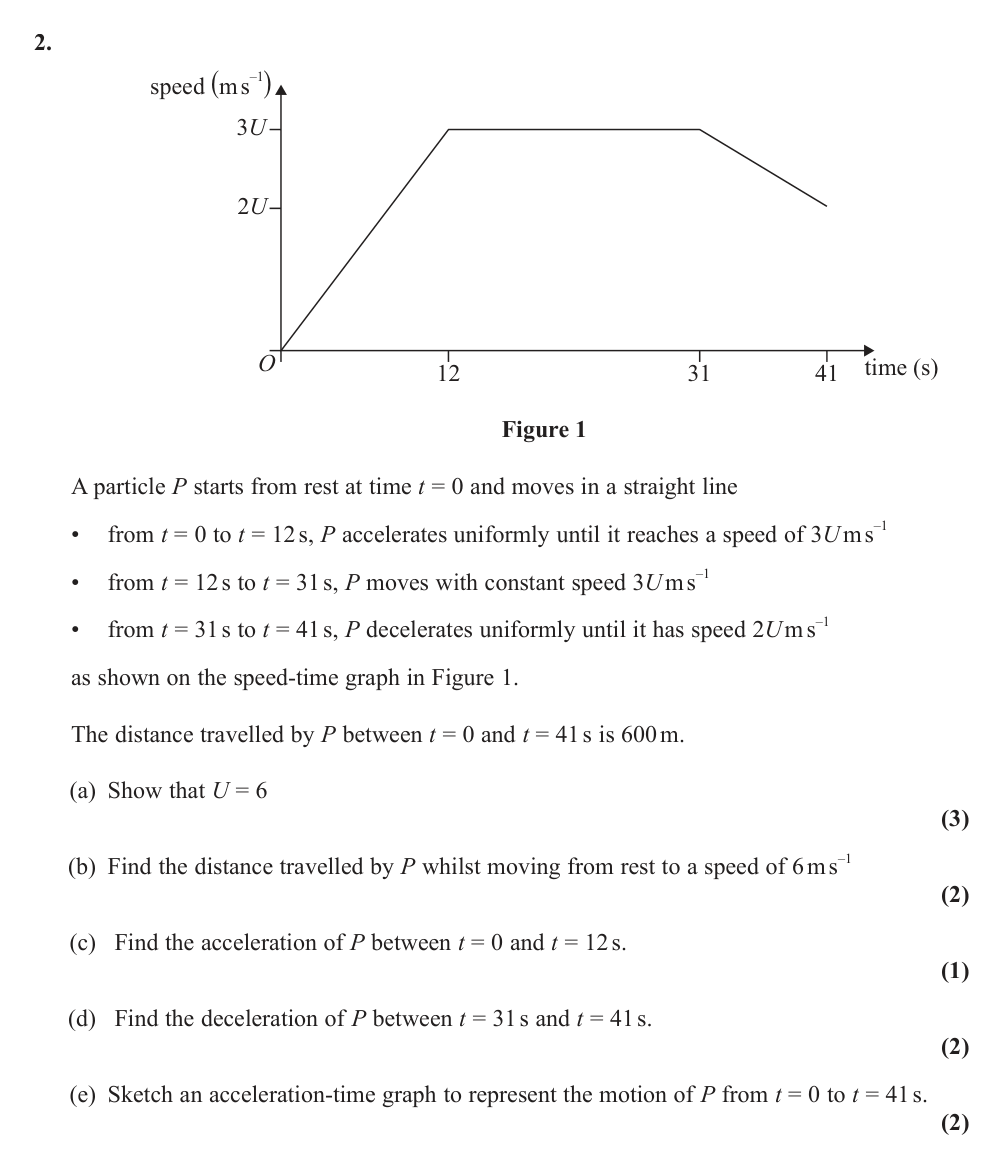
Use area under the speed-time graph
Distance is the area under a speed-time graph. The three areas are a triangle from $0$ to $12$, a rectangle from $12$ to $31$, and a trapezium from $31$ to $41$.
Show that U is 6
$\dfrac12(12)(3U)+19(3U)+\dfrac12(3U+2U)(10)=600$. This gives $18U+57U+25U=600$, so $100U=600$ and $U=6$.
Find the distance to speed 6
Since $U=6$, the final speed $6\ \mathrm{m\,s^{-1}}$ occurs during the first section. The acceleration there is $\dfrac{18-0}{12}=1.5\ \mathrm{m\,s^{-2}}$, so the time to reach $6$ is $4$ s. The distance is $\dfrac12(4)(6)=12\ \mathrm{m}$.
Find the acceleration and deceleration
From $0$ to $12$, $a=\dfrac{18}{12}=1.5\ \mathrm{m\,s^{-2}}$. From $31$ to $41$, the speed falls from $18$ to $12$, so the deceleration is $\dfrac{18-12}{10}=0.6\ \mathrm{m\,s^{-2}}$.
Describe the acceleration-time graph
The acceleration-time graph has three horizontal sections: $1.5$ from $0\leq t\leq 12$, $0$ from $12<t\leq31$, and $-0.6$ from $31<t\leq41$.
Final answer
$(a)\ U=6.\quad (b)\ 12\ \mathrm{m}.\quad (c)\ 1.5\ \mathrm{m\,s^{-2}}.\quad (d)\ 0.6\ \mathrm{m\,s^{-2}}.\quad (e)\ a(t)=1.5,0,-0.6$ on the three intervals.
5. WME01/01 October 2025 · Q6
Hard10 marksShow worked solution
Part (a): Find accelerations
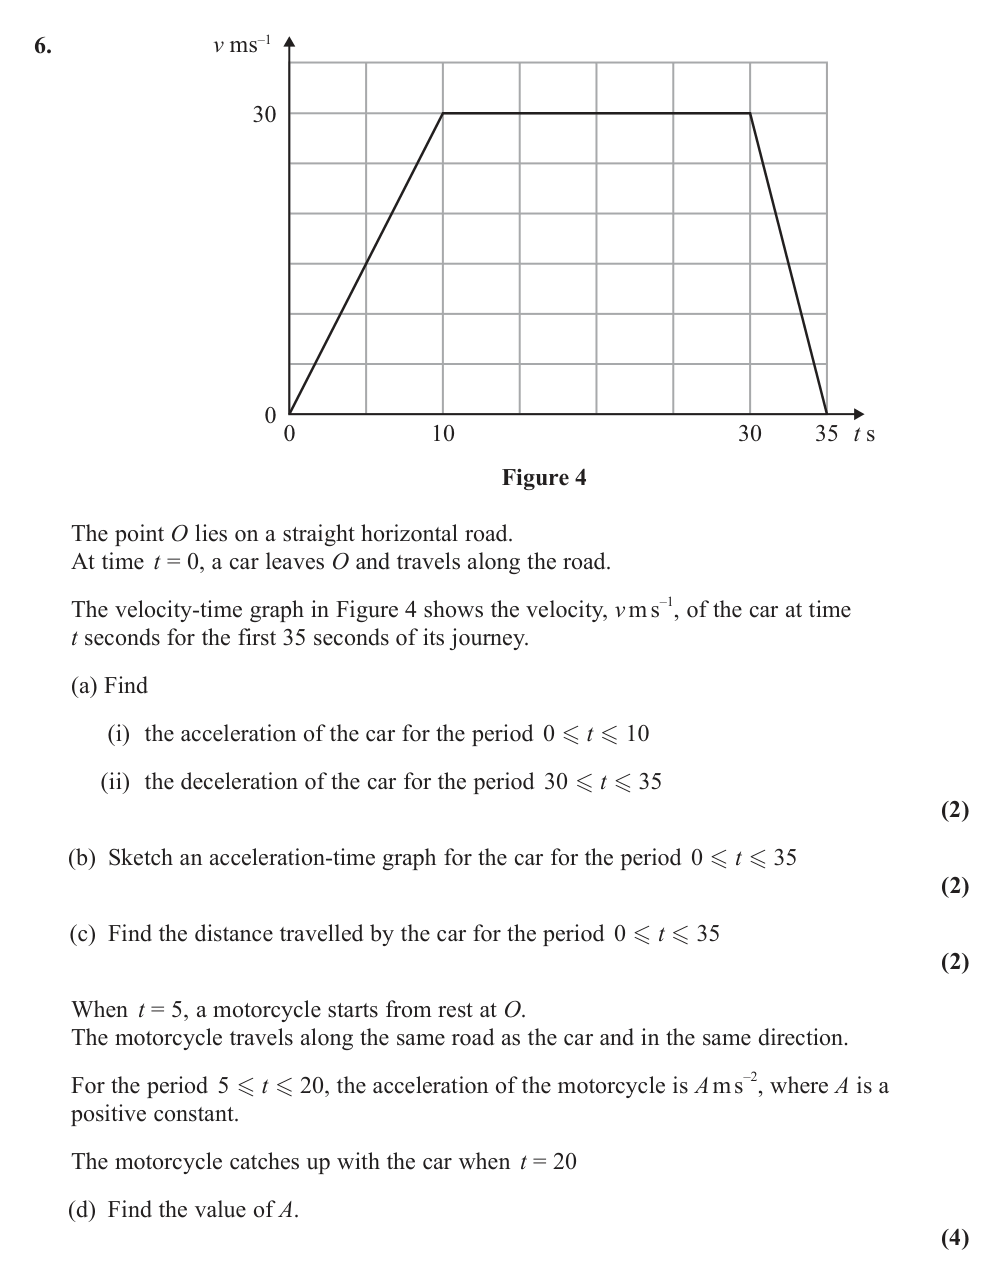
(i) Acceleration for $0 \leq t \leq 10$ $\text{Acceleration} = \frac{\Delta v}{\Delta t} = \text{gradient of v-t graph}$ $a = \frac{30 - 0}{10 - 0}$ $a = 3 \text{ m s}^{-2}$ (ii) Deceleration for $30 \leq t \leq 35$ $a = \frac{0 - 30}{35 - 30}$ $a = \frac{-30}{5}$ $a = -6 \text{ m s}^{-2}$ Deceleration = $|-6| = 6$ m s$^{-2}$
Part (b): Sketch acceleration-time graph
Analysis of each section: ; $0 \leq t \leq 10$: Constant acceleration = 3 m s$^{-2}$ ; $10 < t \leq 30$: Constant velocity, so acceleration = 0 m s$^{-2}$ ; $30 < t \leq 35$: Constant deceleration = $-6$ m s$^{-2}$
Part (c): Find distance travelled for $0 \leq t \leq 35$ - Calculate area under v-t graph
$\text{Distance} = \text{Area under v-t graph}$ The shape is a trapezium. We can split it into regions: Method 1: Trapezium formula $\text{Area} = \frac{1}{2}(a + b)h$ Where the parallel sides are the time intervals and height is velocity. Better to calculate as sum of shapes: Method 2: Sum of triangle + rectangle + triangle $\text{Area}_1 = \frac{1}{2} \times 10 \times 30 = 150 \text{ m}$ $\text{Area}_2 = 20 \times 30 = 600 \text{ m}$ $\text{Area}_3 = \frac{1}{2} \times 5 \times 30 = 75 \text{ m}$ $\text{Total distance} = 150 + 600 + 75$ $= 825 \text{ m}$
Part (d): Find value of A - Distance travelled by car (0 to 20 seconds)
Area under v-t graph from $t = 0$ to $t = 20$: $\text{Distance}_{\text{car}} = \text{Triangle} + \text{Rectangle}$ $= \frac{1}{2}(10)(30) + (10)(30)$ $= 150 + 300$ $= 450 \text{ m}$
Part (d): Find value of A - Distance travelled by motorcycle (5 to 20 seconds)
Motorcycle starts at $t = 5$ with constant acceleration $A$. Time of travel: $20 - 5 = 15$ seconds $s = ut + \frac{1}{2}at^2$ $\text{Distance}_{\text{motorcycle}} = 0 + \frac{1}{2}A(15)^2$ $= \frac{225A}{2}$ $= 112.5A \text{ m}$
Part (d): Find value of A - Set distances equal
Motorcycle catches up with car when $t = 20$: $112.5A = 450$ $A = \frac{450}{112.5}$ $A = 4 \text{ m s}^{-2}$
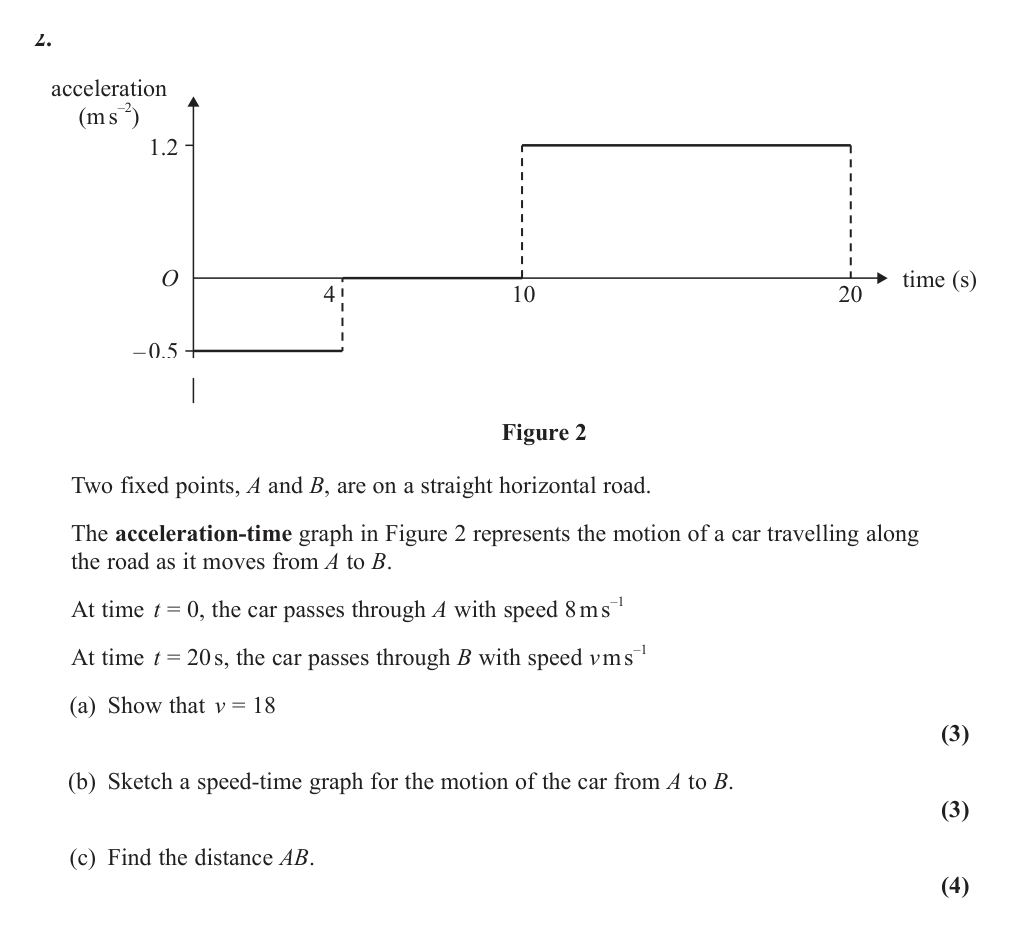
From $0$ to $4$ s the acceleration is $-0.5\ \mathrm{m\,s^{-2}}$. Therefore $w=8+(-0.5)(4)=6\ \mathrm{m\,s^{-1}}$.
Find the final speed
From $10$ to $20$ s the acceleration is $1.2\ \mathrm{m\,s^{-2}}$, while the speed at $t=10$ is still $6$. Hence $v=6+1.2(10)=18\ \mathrm{m\,s^{-1}}$.
Describe the speed-time graph
The graph starts at $(0,8)$, falls linearly to $(4,6)$, stays horizontal to $(10,6)$, then rises linearly to $(20,18)$.
Use area under the speed-time graph
The distance is the area under the graph. From $0$ to $4$: $\dfrac{8+6}{2}\cdot4=28$. From $4$ to $10$: $6\cdot6=36$. From $10$ to $20$: $\dfrac{6+18}{2}\cdot10=120$.
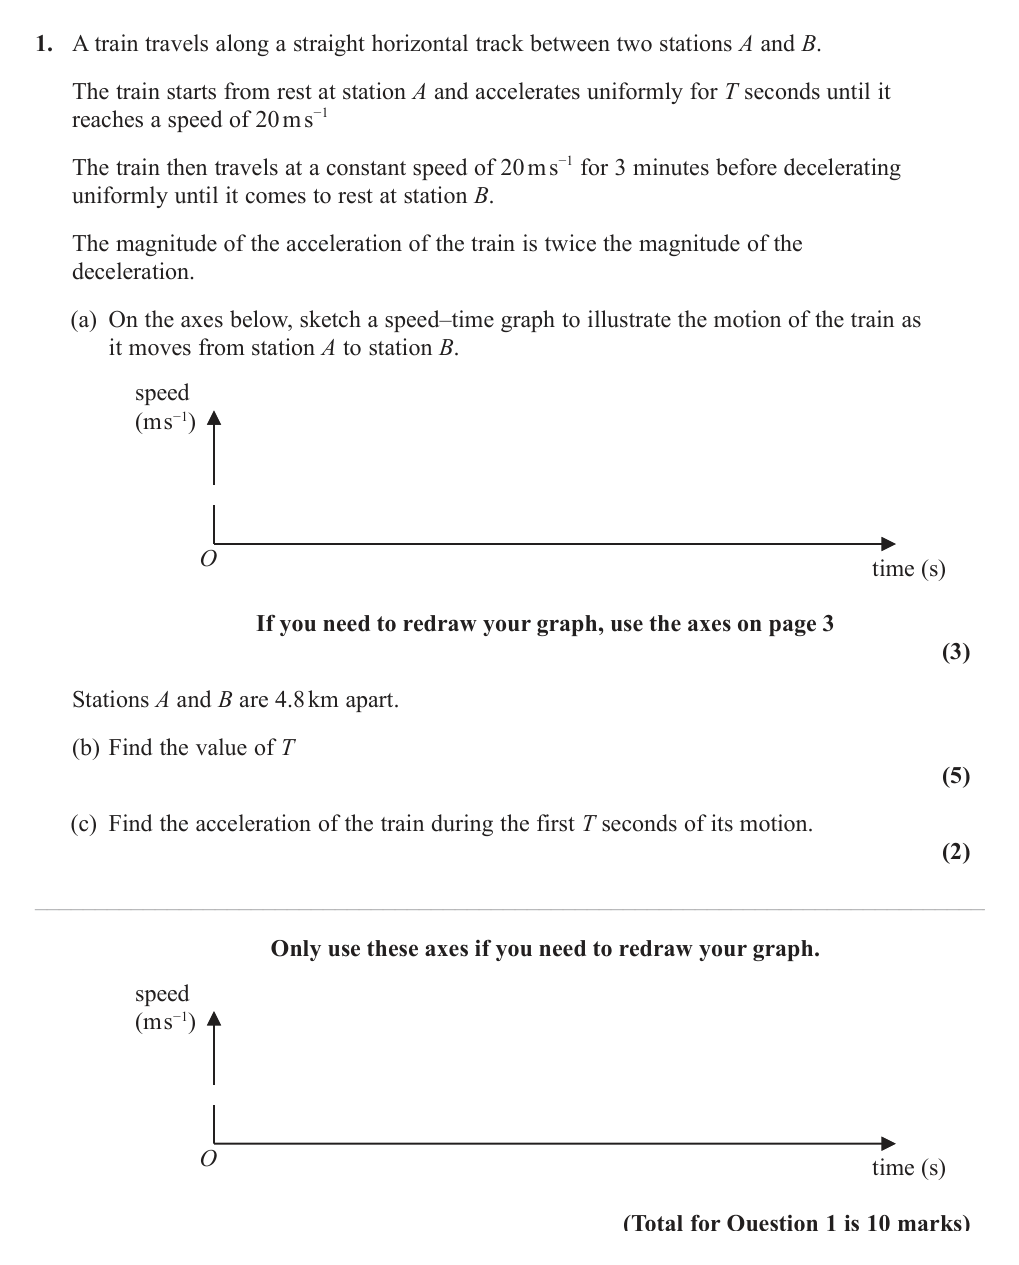
The train reaches $20\ \mathrm{m\,s^{-1}}$ in $T$ seconds. Since the acceleration magnitude is twice the deceleration magnitude, the time needed to decelerate from $20$ to $0$ is $2T$.
Describe the graph
The speed-time graph rises linearly from $(0,0)$ to $(T,20)$, stays horizontal at speed $20$ from $T$ to $T+180$, then falls linearly to zero at $3T+180$.
Use area under the graph
The distance from A to B is $4.8\ \mathrm{km}=4800\ \mathrm{m}$. The area is $\dfrac12(T)(20)+20(180)+\dfrac12(2T)(20)$.
Solve for T
$4800=10T+3600+20T$, so $1200=30T$ and $T=40\ \mathrm{s}$.
Find the acceleration
During the first $T$ seconds, $20=aT$. With $T=40$, $a=\dfrac{20}{40}=0.5\ \mathrm{m\,s^{-2}}$.
Final answer
$(a)$ Speed-time graph with times $T$, $T+180$, $3T+180$ and top speed $20$. $(b)\ T=40\ \mathrm{s}.\quad (c)\ a=0.5\ \mathrm{m\,s^{-2}}$.
8. WME01/01 January 2020 · Q5
Hard10 marksShow worked solution
Describe the graph
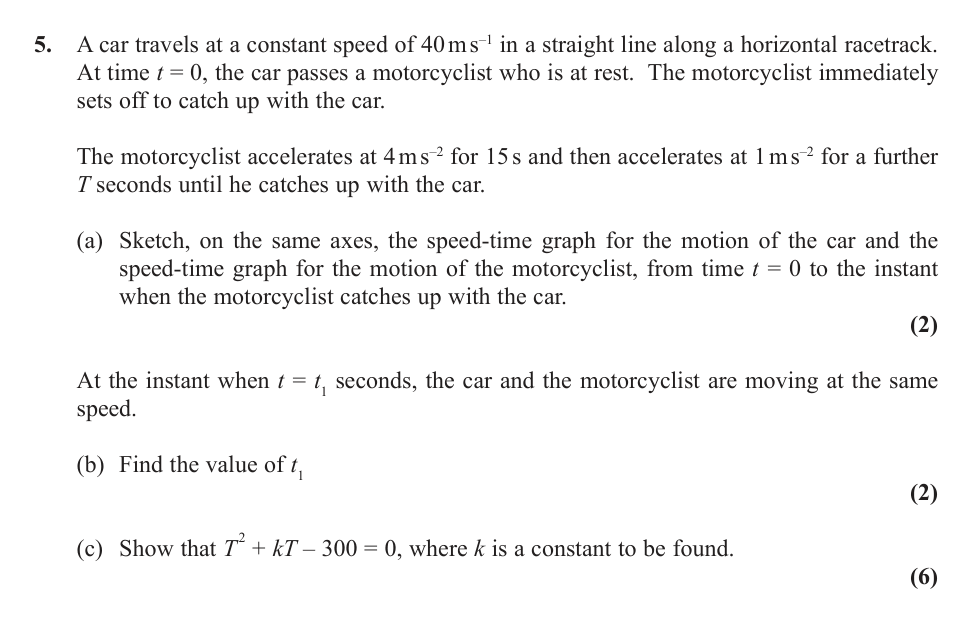
The car's graph is a horizontal line at $40\ \mathrm{m\,s^{-1}}$. The motorcyclist's graph starts at zero, rises with gradient $4$ until $t=15$, then rises with smaller gradient $1$ for a further $T$ seconds.
Find the equal-speed time
Before $t=15$, the motorcyclist's speed is $4t$. Set this equal to the car's speed: $4t_1=40$, so $t_1=10$ s.
Find the motorcyclist's speed at 15 seconds
After the first $15$ seconds, the motorcyclist's speed is $4(15)=60\ \mathrm{m\,s^{-1}}$.
Find the final speed at catch-up
During the next $T$ seconds the acceleration is $1\ \mathrm{m\,s^{-2}}$, so the speed at catch-up is $60+T$.
Equate distances
Motorcyclist distance $=\dfrac12(15)(60)+\dfrac12[60+(60+T)]T$. Car distance $=40(15+T)$.
Simplify the equation
$450+60T+\dfrac12T^2=600+40T$. Hence $\dfrac12T^2+20T-150=0$, so $T^2+40T-300=0$ and $k=40$.
Final answer
$(a)$ Car: horizontal line at $40$; motorcyclist: two rising straight-line sections ending at the catch-up time. $(b)\ t_1=10\ \mathrm{s}.\quad (c)\ T^2+40T-300=0$, so $k=40$.
9. WME01/01 January 2025 · Q2
Hard11 marksShow worked solution
Sketch the speed-time graph
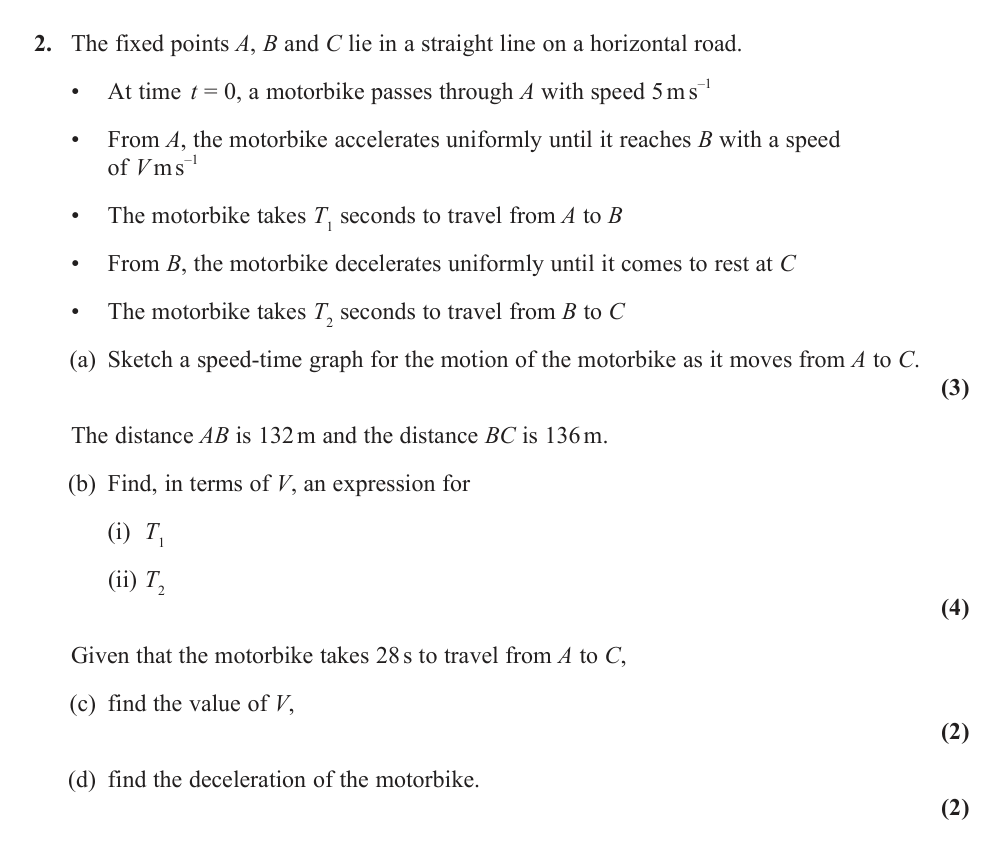
The graph starts at speed $5$ when $t=0$, rises linearly to speed $V$ at time $T_1$, then falls linearly to speed $0$ at time $T_1+T_2$.
Use area from A to B
The area under the first section is the distance $AB=132$. Thus $\dfrac12(5+V)T_1=132$, so $T_1=\dfrac{264}{V+5}$.
Use area from B to C
The second section is a triangle of height $V$ and base $T_2$. Since $BC=136$, $\dfrac12VT_2=136$, so $T_2=\dfrac{272}{V}$.
Use the total time
The whole journey takes $28$ s, so $\dfrac{264}{V+5}+\dfrac{272}{V}=28$.
Solve for V
Multiplying by $V(V+5)$ gives $264V+272(V+5)=28V(V+5)$. This simplifies to $7V^2-99V-340=0$, so $(V-17)(7V+20)=0$. Since speed is positive, $V=17$.
Find the deceleration
For the final section, $T_2=\dfrac{272}{17}=16$ s. The speed falls from $17$ to $0$, so the deceleration is $\dfrac{17}{16}=1.0625\ \mathrm{m\,s^{-2}}$.
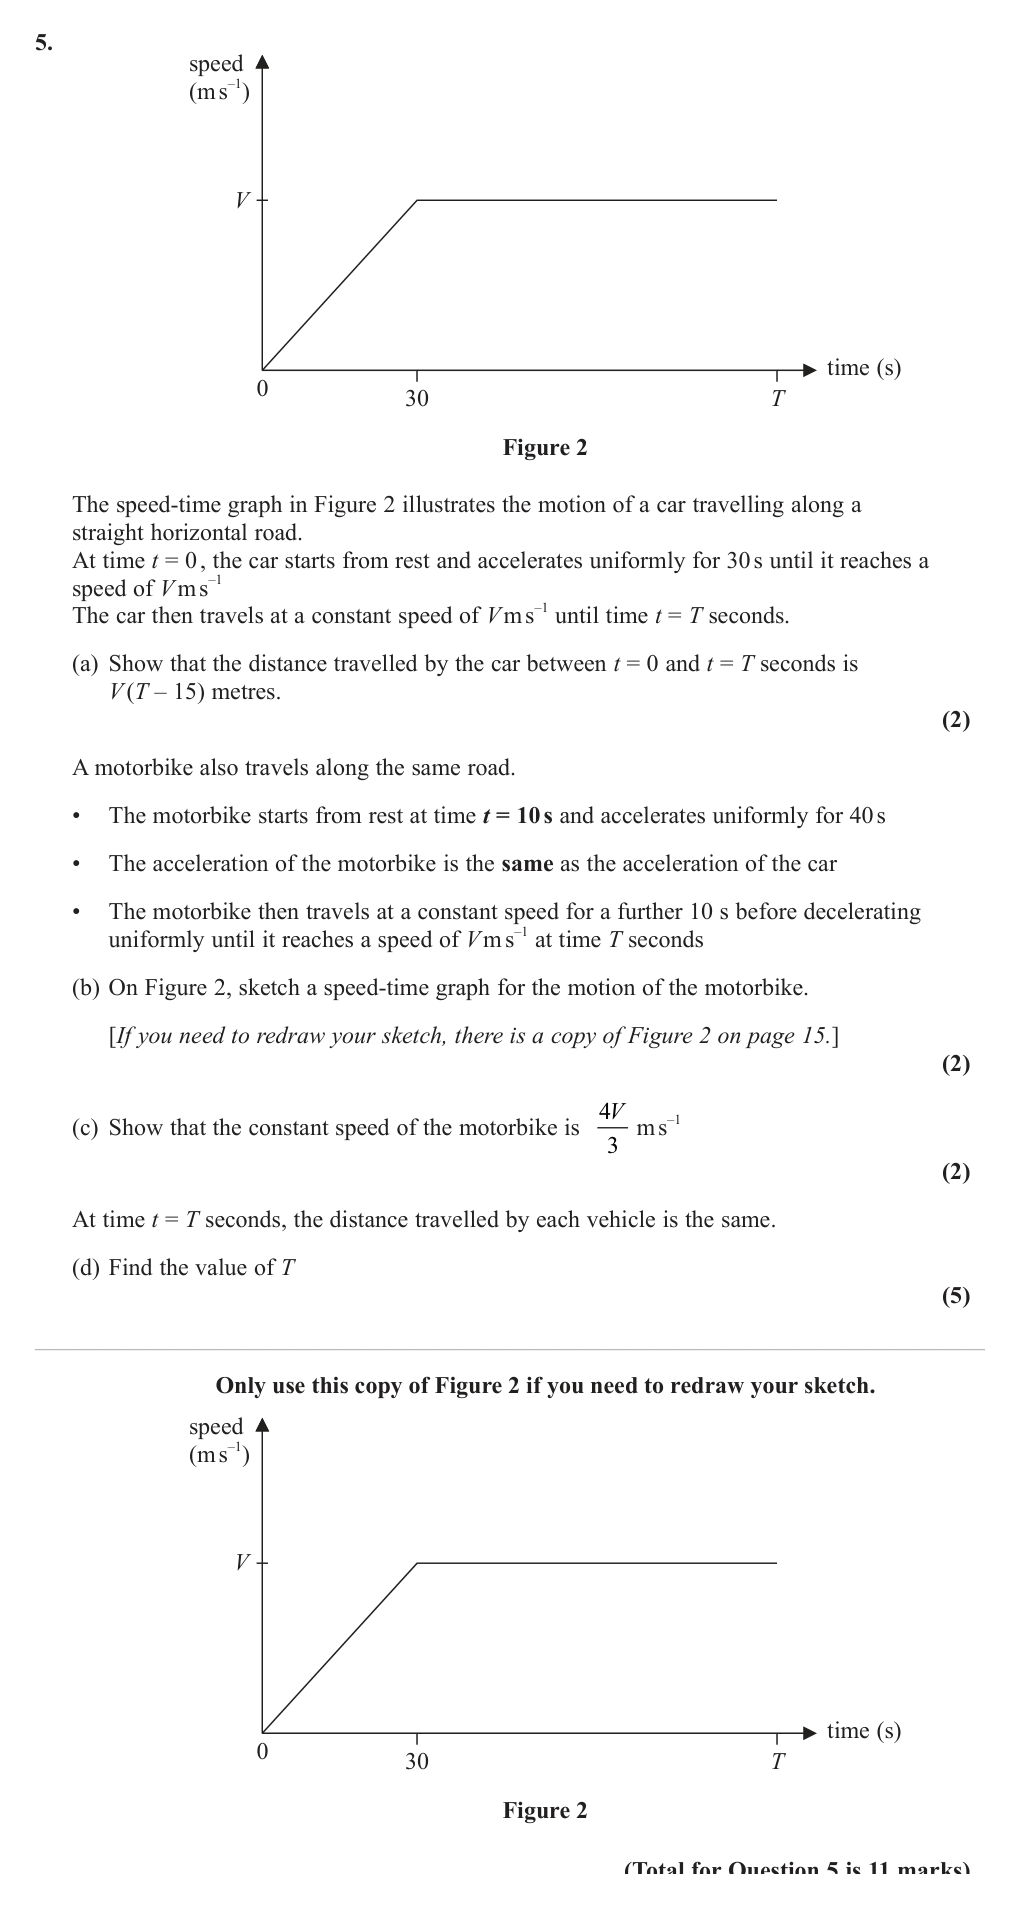
The car graph is a triangle from $0$ to $30$ plus a rectangle from $30$ to $T$. Distance $=\dfrac12(30)V+V(T-30)$.
Simplify the car distance
$\dfrac12(30)V+V(T-30)=15V+VT-30V=V(T-15)$, as required.
Describe the motorbike graph
The motorbike starts at $(10,0)$, accelerates with the same gradient as the car until $t=50$, then travels at constant speed until $t=60$, then decelerates linearly to $(T,V)$.
Find the motorbike constant speed
The car acceleration is $\dfrac{V}{30}$. The motorbike accelerates for $40$ s, so its speed is $40\cdot\dfrac{V}{30}=\dfrac{4V}{3}$.
Find the motorbike distance
Its distance is $\dfrac12(40)\left(\dfrac{4V}{3}\right)+10\left(\dfrac{4V}{3}\right)+\dfrac12\left(\dfrac{4V}{3}+V\right)(T-60)$.
Simplify the motorbike distance
This becomes $\dfrac{80V}{3}+\dfrac{40V}{3}+\dfrac{7V}{6}(T-60)=40V+\dfrac{7V}{6}(T-60)=\dfrac{7VT}{6}-30V$.
Equate the two distances
At time $T$, the distances are equal: $V(T-15)=\dfrac{7VT}{6}-30V$. Divide by $V$ to get $T-15=\dfrac{7T}{6}-30$.
Find T
Multiplying by $6$ gives $6T-90=7T-180$, so $T=90$.
Final answer
$(a)\ \text{car distance}=V(T-15)$. $(b)$ Motorbike graph starts at $t=10$, reaches $\dfrac{4V}{3}$ at $t=50$, stays constant to $t=60$, then falls to $V$ at $t=T$. $(c)\ \text{constant speed}=\dfrac{4V}{3}.\quad (d)\ T=90$.
11. WME01/01 January 2024 · Q6
Hard12 marks · main topic: Constant Acceleration in 1DShow worked solution
Find the impact speed
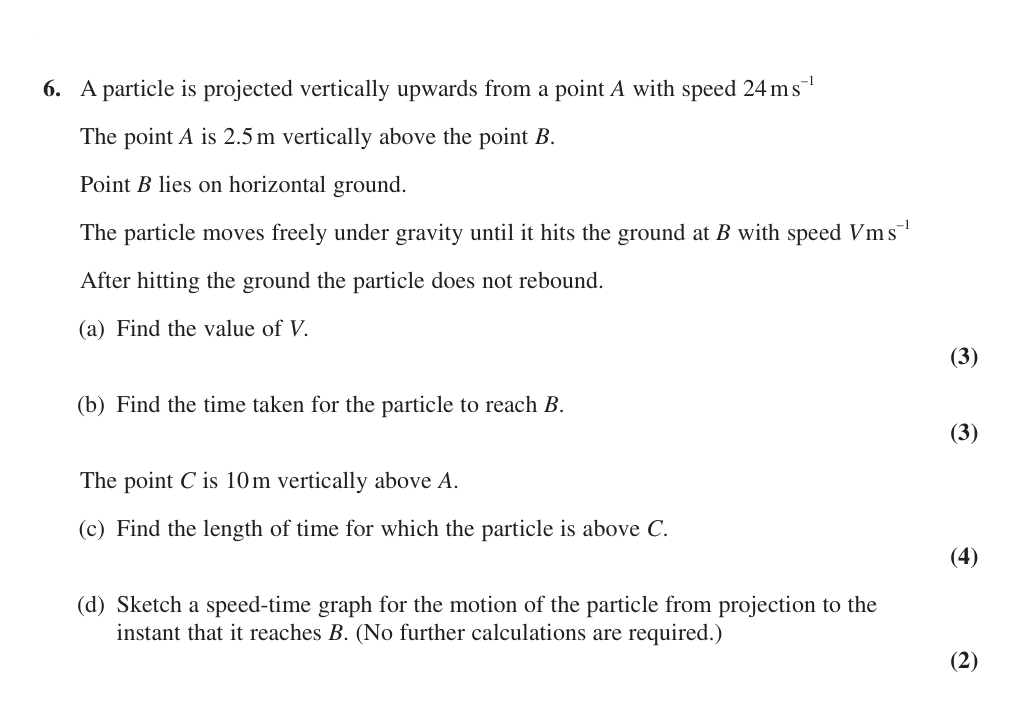
Take upward as positive from A. At B, the displacement is $-2.5$ m, with $u=24$ and $a=-9.8$. Use $v^2=u^2+2as$: $V^2=24^2+2(-9.8)(-2.5)=625$.
State V
$V=25\ \mathrm{m\,s^{-1}}$.
Find the time to reach B
The velocity at B is $-25\ \mathrm{m\,s^{-1}}$. Using $v=u+at$, $-25=24-9.8t$, so $t=5\ \mathrm{s}$.
Set up the height C equation
C is $10$ m above A. The particle is above C between the two times when $s=10$: $10=24t-4.9t^2$.
Solve for the two crossing times
$4.9t^2-24t+10=0$, giving $t=0.459\ldots$ and $t=4.438\ldots$.
Find the time above C
The length of time above C is $4.438\ldots-0.459\ldots=3.98\ldots\ \mathrm{s}$, about $4.0\ \mathrm{s}$.
Describe the speed-time graph
The graph starts at speed $24$, decreases linearly to $0$ at the highest point, then increases linearly to speed $25$ at $t=5$. It is a V-shaped speed-time graph.
Final answer
$(a)\ V=25\ \mathrm{m\,s^{-1}}.\quad (b)\ t=5\ \mathrm{s}.\quad (c)\ 4.0\ \mathrm{s}\ \text{approximately}$. (d) Speed-time graph is V-shaped, from speed 24 to 0, then to speed 25 at t=5.
12. WME01/01 January 2021 · Q7
Hard12 marksShow worked solution
Find speed when parachute opens
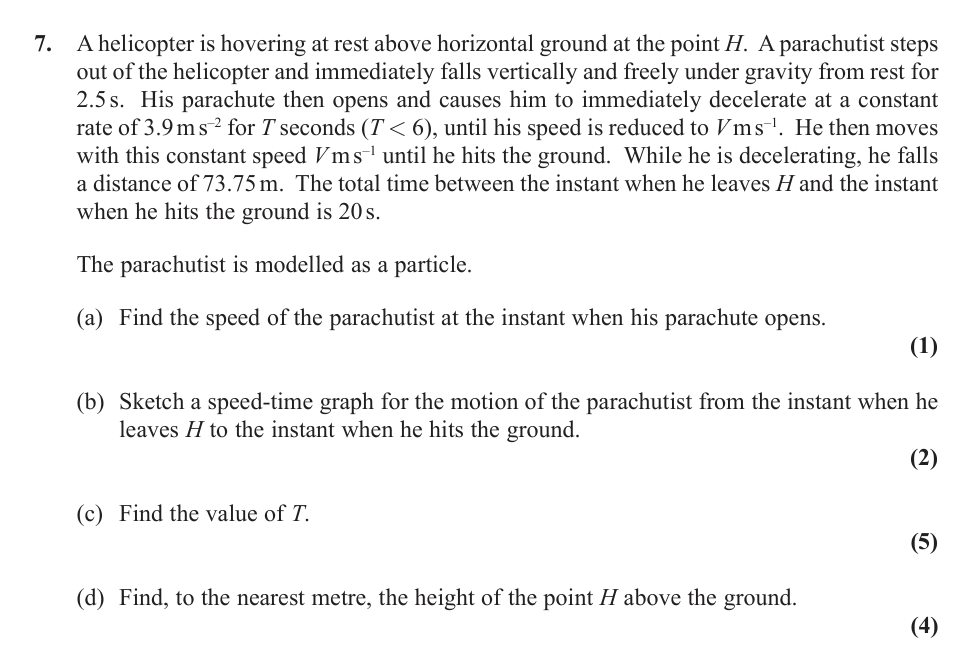
The parachutist falls freely from rest for $2.5$ s, so $v=gt=9.8(2.5)=24.5\ \mathrm{m\,s^{-1}}$.
Describe the graph
The speed-time graph starts at $0$, rises linearly to $24.5$ at $t=2.5$, then decreases linearly with smaller gradient for $T$ seconds, then stays horizontal at speed $V$ until $t=20$.
Use the deceleration distance
During the deceleration phase, initial speed is $24.5$, acceleration is $-3.9$, time is $T$, and distance is $73.75$.
Form the equation for T
$73.75=24.5T+\dfrac12(-3.9)T^2=24.5T-1.95T^2$.
Choose the valid T
Solving gives $T=5$ or $T=7.56\ldots$. Since $T<6$, take $T=5$.
Find V
$V=24.5-3.9(5)=5\ \mathrm{m\,s^{-1}}$.
Find the total height
Height is the total area under the speed-time graph: first triangle $\dfrac12(2.5)(24.5)=30.625$, deceleration distance $73.75$, and final rectangle $(20-2.5-5)(5)=62.5$.
Round the height
Total height $=30.625+73.75+62.5=166.875$ m, which rounds to $167$ m.
Final answer
$(a)\ 24.5\ \mathrm{m\,s^{-1}}.\quad (b)$ Speed-time graph rises to $24.5$ at $t=2.5$, falls to $V$ at $t=2.5+T$, then is horizontal to $t=20$. $(c)\ T=5.\quad (d)\ H=167\ \mathrm{m}$ to the nearest metre.
13. WME01/01 October 2019 · Q6
Hard12 marksShow worked solution
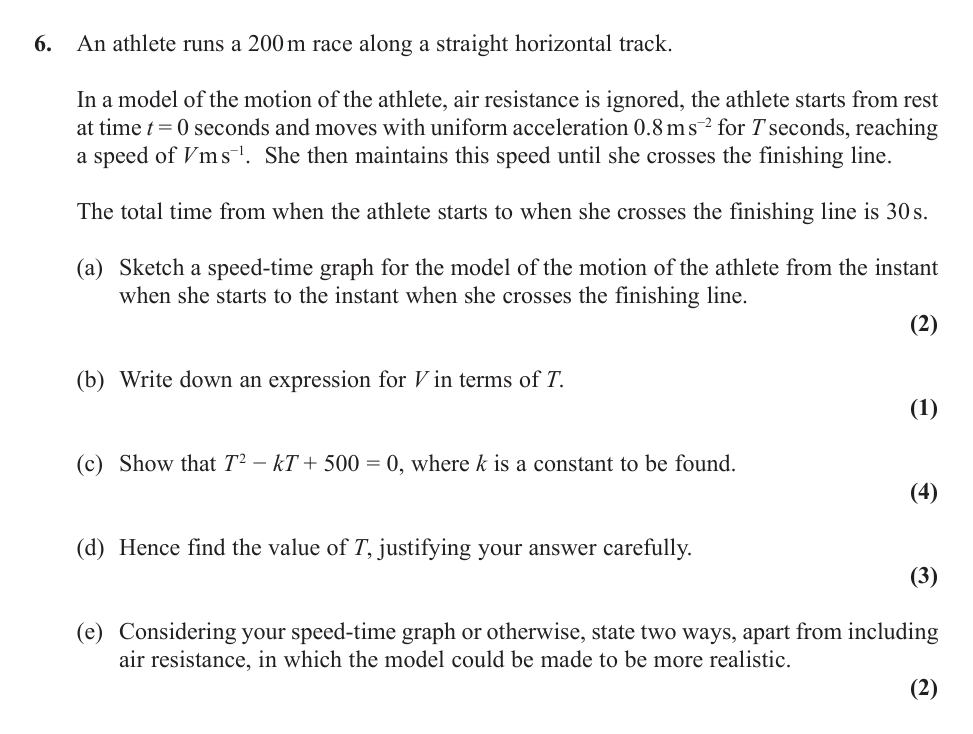
Describe the speed-time graph
The graph starts at $(0,0)$, rises in a straight line with gradient $0.8$ until time $T$ and speed $V$, then stays horizontal at speed $V$ until $t=30$.
Write V in terms of T
Uniform acceleration gives $V=0.8T$.
Use area for the distance
The distance is the area under the speed-time graph: $\dfrac12TV+V(30-T)=200$.
Substitute V
Using $V=0.8T$: $\dfrac12T(0.8T)+(0.8T)(30-T)=200$.
Form the quadratic
$0.4T^2+24T-0.8T^2=200$, so $-0.4T^2+24T-200=0$. Multiplying by $-2.5$ gives $T^2-60T+500=0$, so $k=60$.
Solve and choose the valid root
$T^2-60T+500=(T-10)(T-50)=0$, so $T=10$ or $50$. Since the whole race lasts $30$ s, $T=10$.
Give two model improvements
A more realistic model could include reaction time at the start, and could replace the instantaneous change from acceleration to constant speed with a smoother transition.
Final answer
$(a)$ Speed-time graph rises linearly to $V$ at $t=T$, then is horizontal until $t=30$. $(b)\ V=0.8T.\quad (c)\ T^2-60T+500=0$, so $k=60$. $(d)\ T=10$. $(e)$ For example, include reaction time at the start and avoid the instantaneous change to constant speed.
14. WME01/01 October 2024 · Q4
Hard13 marksShow worked solution
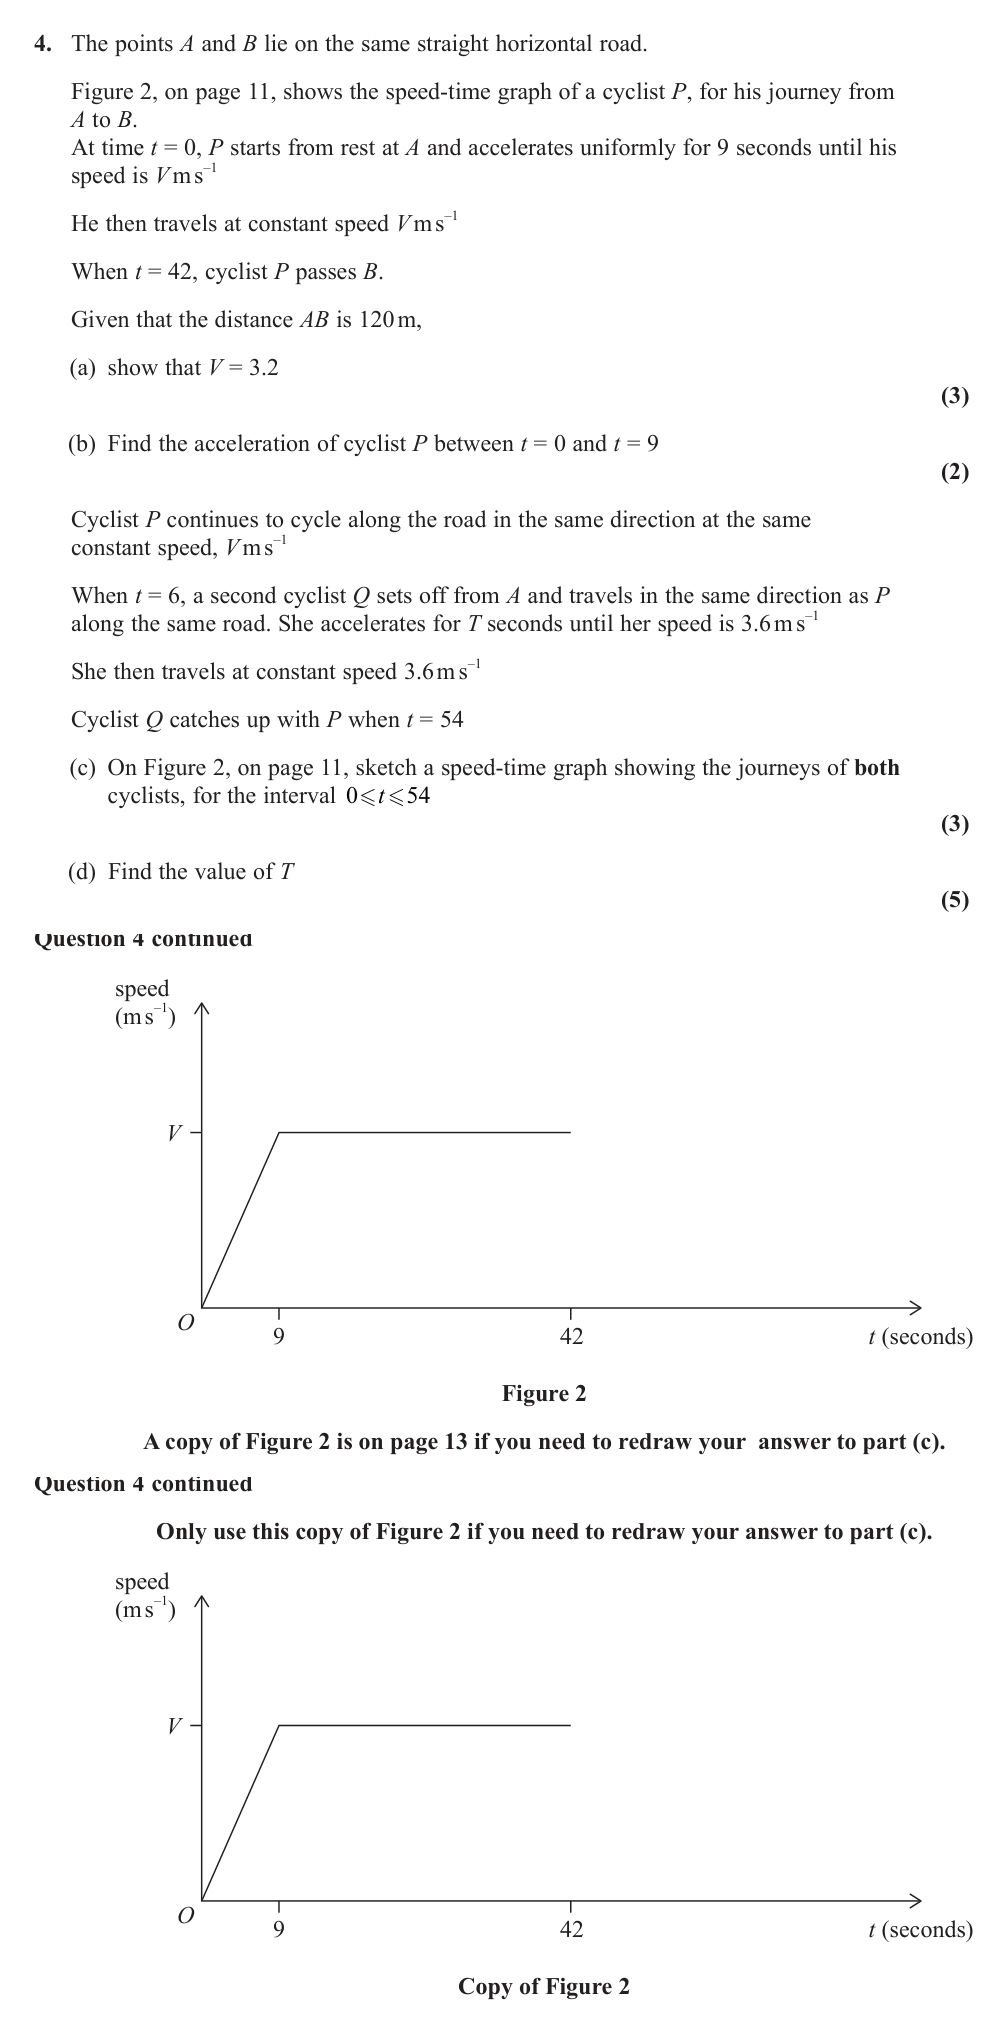
Use the area under P graph
For cyclist P, the distance from A to B is the area under the speed-time graph from $0$ to $42$. This is $\dfrac12(9)V+33V=120$.
Show V is 3.2
$4.5V+33V=37.5V=120$, so $V=3.2\ \mathrm{m\,s^{-1}}$.
Find P acceleration
Between $t=0$ and $t=9$, P accelerates from $0$ to $3.2$. Hence $a=\dfrac{3.2}{9}=\dfrac{16}{45}=0.356\ldots\ \mathrm{m\,s^{-2}}$.
Describe Q graph
Cyclist Q starts at $t=6$ from rest, accelerates in a straight line for $T$ seconds to speed $3.6\ \mathrm{m\,s^{-1}}$, then continues horizontally at $3.6\ \mathrm{m\,s^{-1}}$ until $t=54$.
Find P distance by t equals 54
By $t=54$, P has travelled $\dfrac12(9)(3.2)+45(3.2)=14.4+144=158.4\ \mathrm{m}$.
Form Q distance in terms of T
Q travels for $48$ seconds after starting at $t=6$. Her distance is $\dfrac12T(3.6)+(48-T)(3.6)=172.8-1.8T$.
Solve for T
Q catches P at $t=54$, so $172.8-1.8T=158.4$. Thus $1.8T=14.4$ and $T=8$ s.
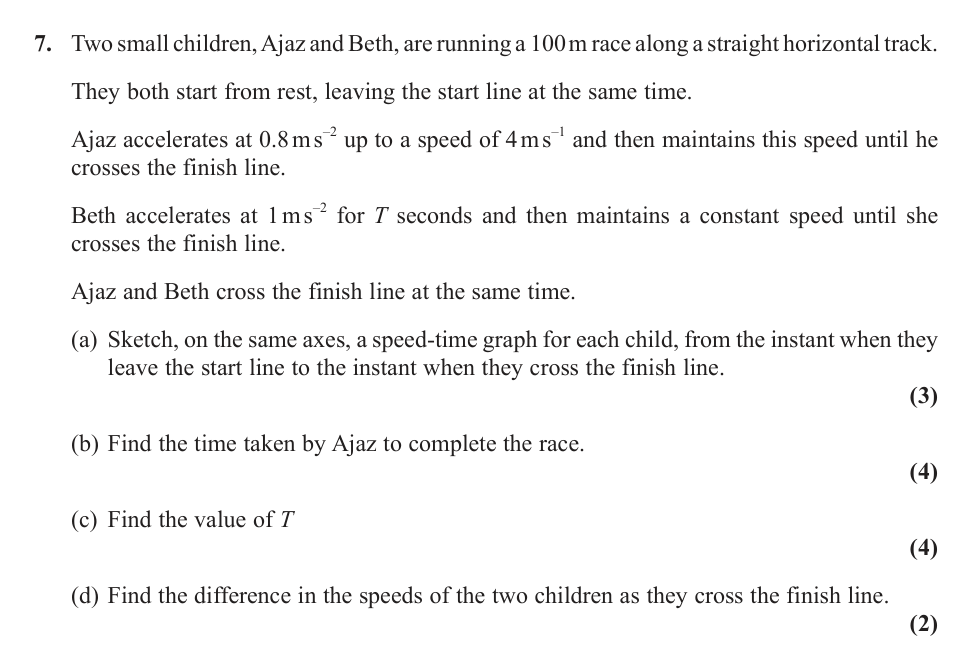
$(a)$ Ajaz reaches speed $4$ then runs horizontally; Beth has a steeper initial line to speed $T$, then horizontal, both ending at the same time. $(b)\ 27.5\ \mathrm{s}.\quad (c)\ T=3.92\ \mathrm{s}\ \text{approximately}.\quad (d)\ 0.085\ \mathrm{m\,s^{-1}}\ \text{approximately}$.
16. WME01/01 May/June 2021 · Q8
Hard13 marksShow worked solution
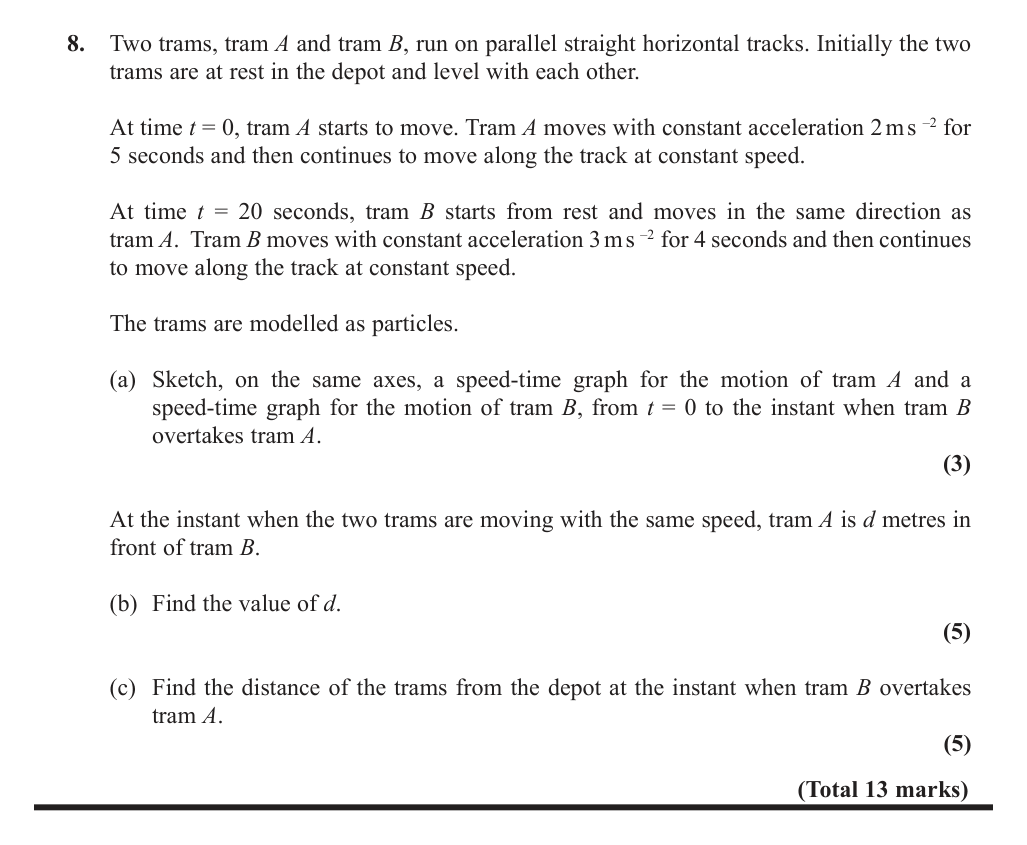
Describe tram A graph
Tram A starts at $t=0$, accelerates at $2\ \mathrm{m\,s^{-2}}$ for $5$ s, reaching speed $10\ \mathrm{m\,s^{-1}}$, then continues at this constant speed.
Describe tram B graph
Tram B starts at $t=20$, accelerates at $3\ \mathrm{m\,s^{-2}}$ for $4$ s, reaching speed $12\ \mathrm{m\,s^{-1}}$, then continues at this constant speed. Its graph crosses A's distance later.
Find when speeds are equal
Tram A's constant speed is $10$. Tram B reaches speed $10$ after $\dfrac{10}{3}$ s of acceleration, so the time from $t=0$ is $20+\dfrac{10}{3}=\dfrac{70}{3}$ s.
Distance of A then
A travels $\dfrac12(5)(10)=25$ m in its acceleration phase, then $10\left(\dfrac{70}{3}-5\right)=\dfrac{550}{3}$ m. Total $=\dfrac{625}{3}$ m.
Distance of B then
B is still accelerating from rest, so its distance is $\dfrac12\left(\dfrac{10}{3}\right)(10)=\dfrac{50}{3}$ m.
Find d
$d=\dfrac{625}{3}-\dfrac{50}{3}=\dfrac{575}{3}$ m.
Set overtake distances equal
For $t>24$, A's distance is $25+10(t-5)=10t-25$. B's distance is $\dfrac12(4)(12)+12(t-24)=12t-264$.
Find the overtake time
Set $10t-25=12t-264$. Then $2t=239$ and $t=119.5$ s.
Find the distance from the depot
Using A's distance, $10(119.5)-25=1170$ m.
Final answer
$(a)$ Tram A reaches speed $10$ at $t=5$; tram B starts at $t=20$, reaches speed $12$ at $t=24$, then later overtakes A. $(b)\ d=\dfrac{575}{3}\ \mathrm{m}\approx192\ \mathrm{m}.\quad (c)\ 1170\ \mathrm{m}$.
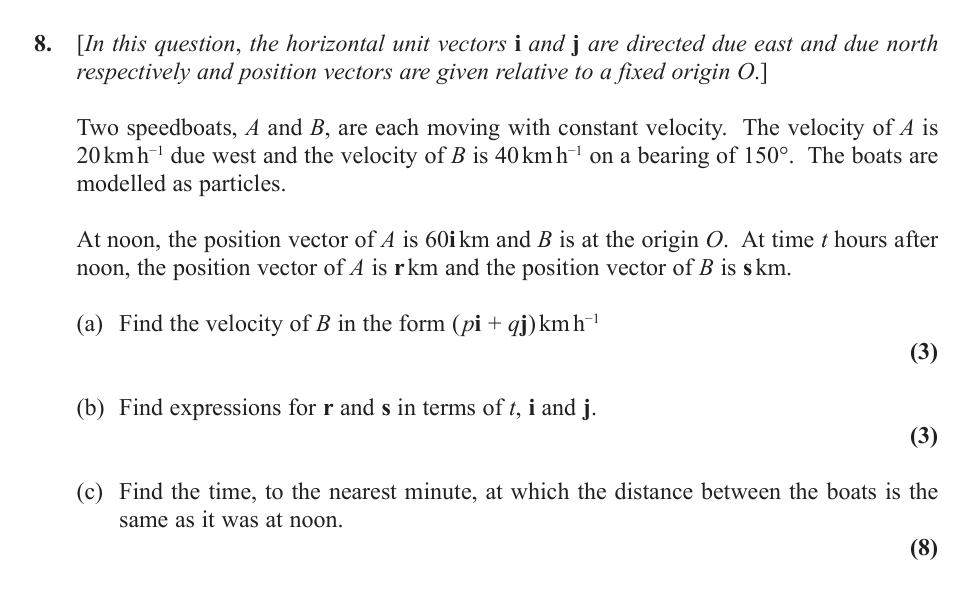
17. WME01/01 October 2019 · Q8
Hard14 marks · main topic: Working with VectorsShow worked solution
Resolve B's velocity
A bearing of $150^\circ$ is $30^\circ$ east of south. Therefore the east component is $40\sin150^\circ=20$ and the north component is $40\cos150^\circ=-20\sqrt3$.
 Elite Mathematics